Home
Images
Vectors
Videos
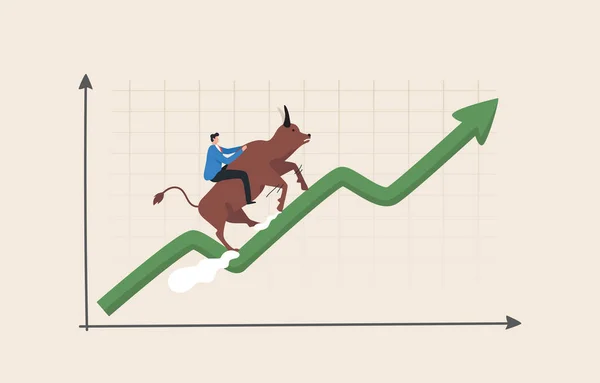
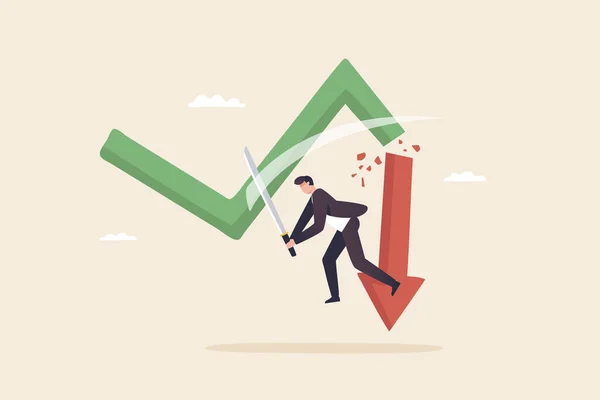
Stock image Stock market volatility or the stock chart that goes up and down alternately. investment risk and uncertainty. Invest cautiously in recession market conditions. A businessman walks carefully on the arrow graph.
Published:
Sep.06, 2022 14:35:50
Author:
yellow_man
Views:
6
Downloads:
2
File type:
image
/
jpg
File size:
0.95 MB
Orginal size:
5212
x
3334
px
Available sizes:
S
(500 x 320)
M
(1000 x 640)
L
(2000 x 1279)
XL
(5212 x 3334)
EL0
(5212 x 3334)
Level:
beginner
Download Image
Image topics:
Money
Financial
Growth
Men
Graphics
Glow
Finances
Invest
Crisis
Economics
Arrows
Prices
Depression
Conceptual
Changes
Falling
Problems
Bankruptcy
Loss
Analysis
Management
Investing
Businesses
Signs
Economic
Businessmen
Inflation
Investments
Increase
Funds
Panic
Sells
Investor
Pandemic
Stocks
Returns
Infection
Markets
Debts
Charts
Crashed
Graphs
Companies
Risks
Rises
Diagrams
Downs
Revivals
Recessions
Restores
Similar stock images
Bull Market Or Bull Run, Refers To The Time When Most Investors Buy. More Demand Than Supply Market Sentiment Is High And Prices Go Up. Bullish Investors Run On The Upward Arrow Chart.
6945 × 4445
Cut Loss Concept. Stop Losing Assets From Stock Market Volatility. Stop Loss Minimize Losses For Profit
6250 × 4167
Growing Business Graph With A Man
2400 × 1800
Business Concept. Young Manager, Finance Analyst Or Clerk In Office Suit Isolated On Blue Background. Collage, Illustration
3000 × 3000
Relaxed Smiling Businessman Lying On A Graph Going Up.. 3d Illustration.
4000 × 4000
Businessman On A Finance Graphic Aiming For The Top
2400 × 1800
Sign Displaying Non Profit, Concept Meaning Providing Products Or Service Without Paying Back In Return Man Raising Hand To The Sky Standing On Top Hill Showing Success.
8000 × 4000