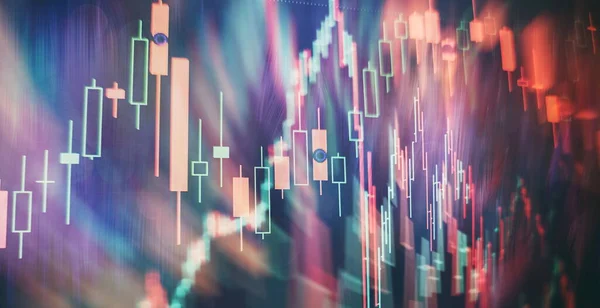
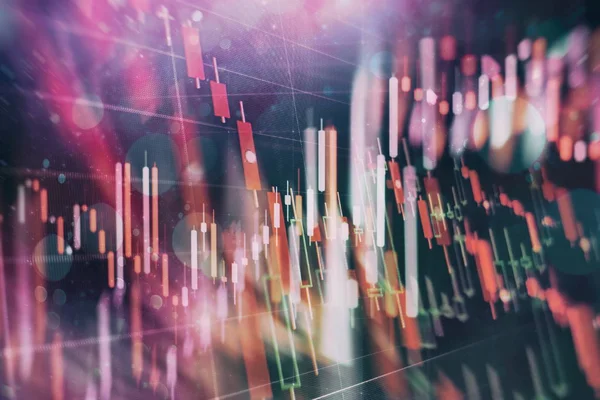
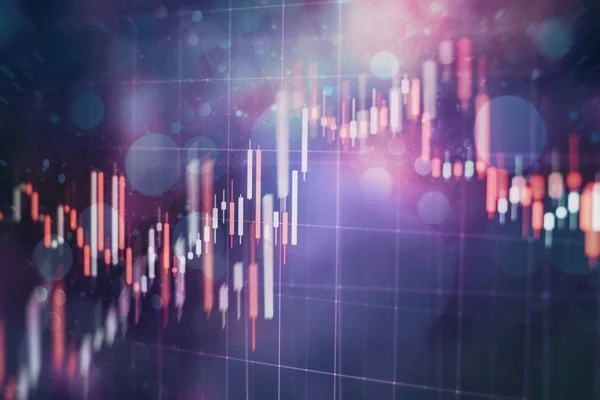
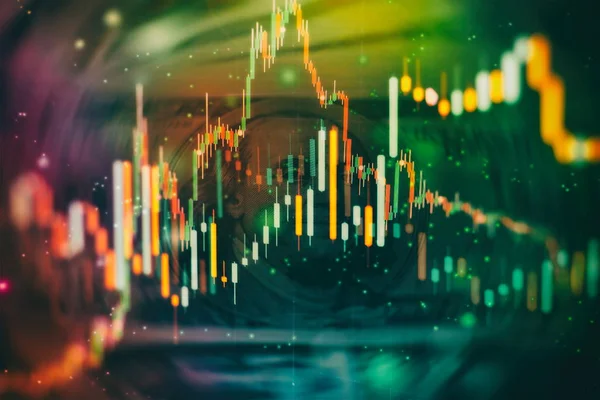
Stock image Technical price graph and indicator, red and green candlestick chart on blue theme screen, market volatility, up and down trend. Stock trading, crypto currency background.

Published: May.21, 2019 12:40:09
Author: Maximusdn
Views: 0
Downloads: 0
File type: image / jpg
File size: 7.77 MB
Orginal size: 5315 x 3543 px
Available sizes:
Level: bronze
Similar stock images

Candle Stick Graph Chart Of Stock Market Investment Trading. The Forex Graph Chart On The Digital Screen.
5315 × 3543
Candle Stick Graph Chart Of Stock Market Investment Trading. The Forex Graph Chart On The Digital Screen.
5315 × 3543
Data On A Monitor Which Including Of Market Analyze. Bar Graphs, Diagrams, Financial Figures. Forex Chart.
3543 × 2362
Candle Stick Graph Chart Of Stock Market Investment Trading. The Forex Graph Chart On The Digital Screen.
5315 × 3543

Financial Accounting Of Profit Summary Graphs Analysis. The Business Plan At The Meeting And Analyze
5315 × 3543

Forex Glowing Graphs Of Different Colors Showing Financial Market Situation On Abstract Digital Background.
5315 × 3543