Stock image Technical price graph and indicator, red and green candlestick chart on blue theme screen, market volatility, up and down trend. Stock trading, crypto currency background.

Published: Jun.03, 2019 13:48:59
Author: Maximusdn
Views: 3
Downloads: 1
File type: image / jpg
File size: 4.77 MB
Orginal size: 5315 x 3543 px
Available sizes:
Level: bronze
Similar stock images


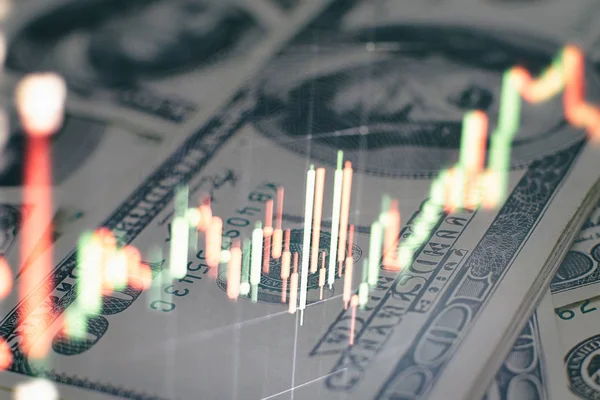
Double Exposure Of Forex Graph Drawing Over Us Dollars Bill Background. Concept Of Financial Markets.
4500 × 3000
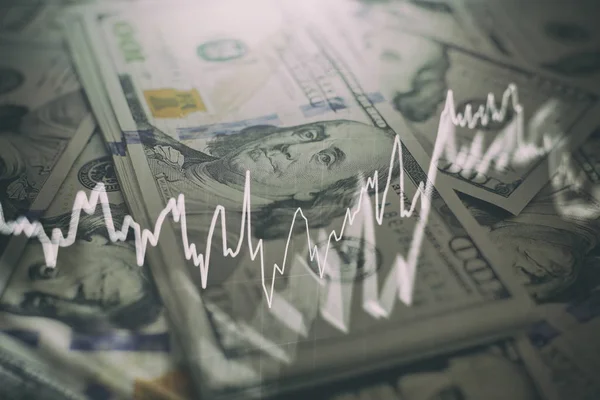

Double Exposure Of Forex Graph Drawing Over Us Dollars Bill Background. Concept Of Financial Markets.
4500 × 3000