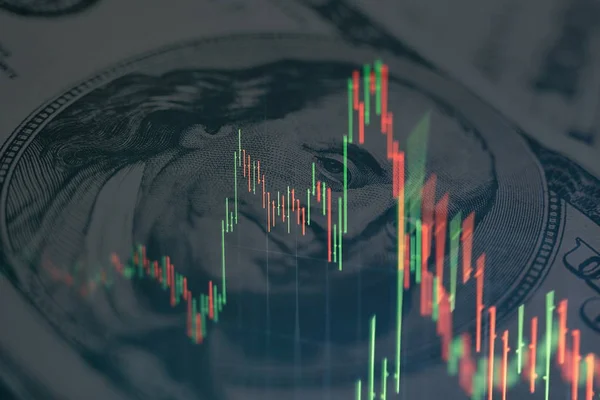
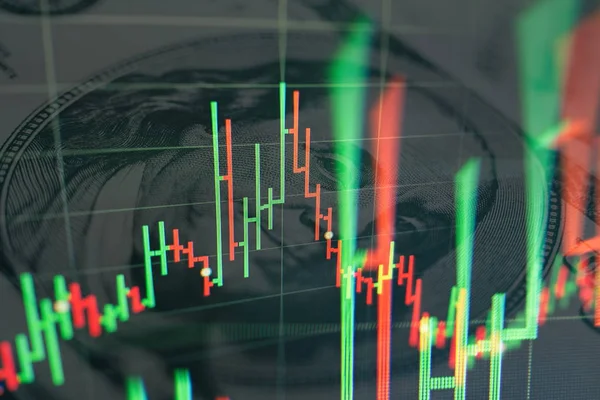
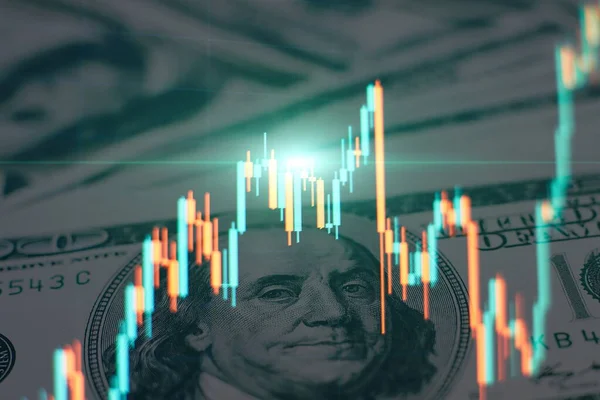
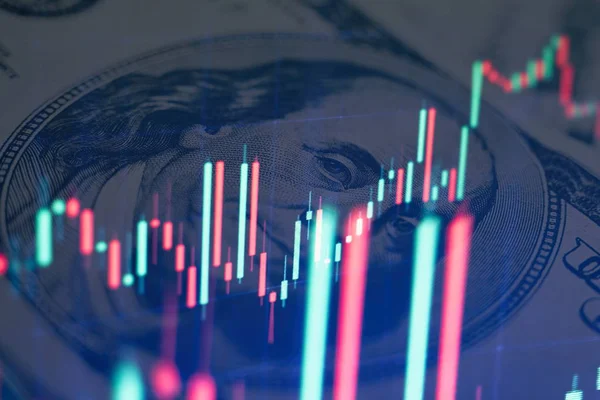
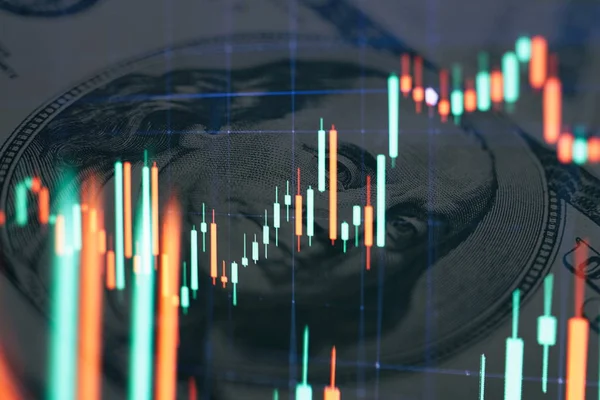
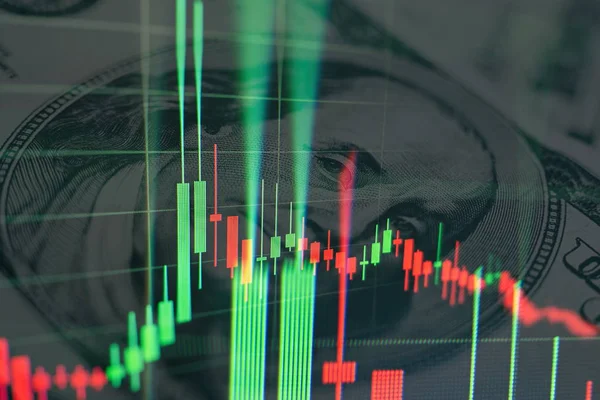
Stock image Technical price graph and indicator, red and green candlestick chart on blue theme screen, market volatility, up and down trend. Stock trading, crypto currency background.

Published: Jun.03, 2019 13:48:58
Author: Maximusdn
Views: 0
Downloads: 0
File type: image / jpg
File size: 2.47 MB
Orginal size: 3543 x 2362 px
Available sizes:
Level: bronze
Similar stock images


Candle Stick Graph Chart Of Stock Market Investment Trading, Stock Exchange Concept Design And Background.
5315 × 3543