photo free
Home Images Vectors Videos

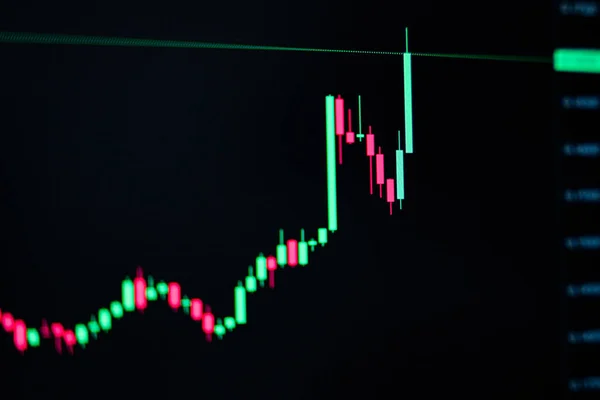
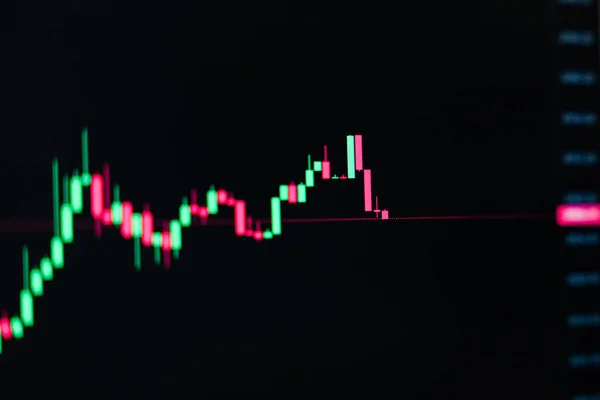
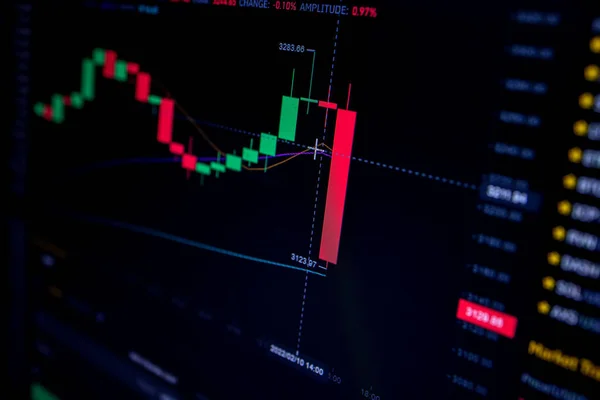
Stock image Technical trading of candlestick signal graph fast moving with panic market, Line graph of green and red color candle of selling and buying during business hours for trading investment

Stock image Technical trading of candlestick signal graph fast moving with panic market, Line graph of green and red color candle of selling and buying during business hours for trading investment
Published: Jun.07, 2022 12:36:42
Author: Mumemories
Views: 3
Downloads: 0
File type: image / jpg
File size: 5 MB
Orginal size: 6680 x 4454 px
Available sizes:
S
(500 x 333)
M
(1000 x 667)
L
(2000 x 1334)
XL
(6680 x 4454)
EL0
(6680 x 4454)
Level: bronze
Download Image
Image topics:

Similar stock images

stock image Technical trading of candlestick signal graph fast moving with panic market, Line graph of green and red color candle of selling and buying during business hours for trading investment

Technical Trading Of Candlestick Signal Graph Fast Moving With Panic Market, Line Graph Of Green And Red Color Candle Of Selling And Buying During Business Hours For Trading Investment

5684 × 3789
stock image Closeup of international stock market bids graph

Closeup Of International Stock Market Bids Graph

6033 × 2011
stock image Technical trading of candlestick signal graph fast moving with panic market, Line graph of green and red color candle of selling and buying during business hours for trading investment

Technical Trading Of Candlestick Signal Graph Fast Moving With Panic Market, Line Graph Of Green And Red Color Candle Of Selling And Buying During Business Hours For Trading Investment

5895 × 3930
stock image Candle stick graph chart with indicator showing bullish point, up trend of price of stock market or stock exchange, investment and financial concept

Candle Stick Graph Chart With Indicator Showing Bullish Point, Up Trend Of Price Of Stock Market Or Stock Exchange, Investment And Financial Concept

6720 × 4480
stock image Droping Candle stick graph chart of stock market investment trading. Finance background data graph. Online forex data. Professional market analysis.

Droping Candle Stick Graph Chart Of Stock Market Investment Trading. Finance Background Data Graph. Online Forex Data. Professional Market Analysis.

5705 × 3803
stock video Close up of an artist painting with water colors

Close Up Of An Artist Painting With Water Colors

4096 × 2160
stock image Candle stick graph chart of stock market investment trading, Bullish point, Bearish point. trend of graph

Candle Stick Graph Chart Of Stock Market Investment Trading, Bullish Point, Bearish Point. Trend Of Graph

5472 × 3648
stock image bitcoin cryptocurrency data charts

Bitcoin Cryptocurrency Data Charts

8192 × 5464