photo free
Home Images Vectors Videos

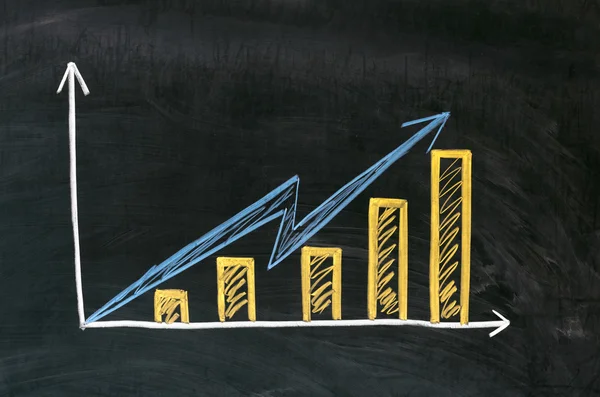
Stock image The graph shows the increase of the target drawn in chalk on the Board
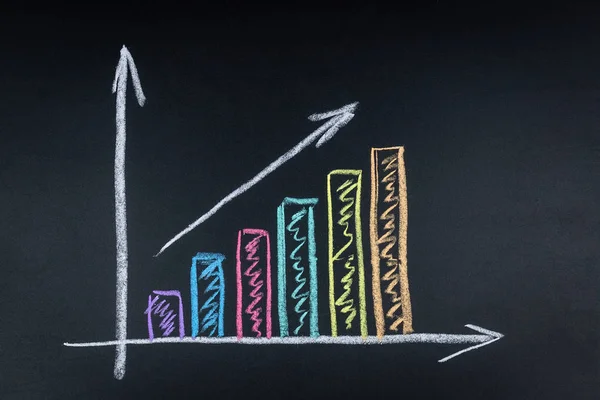
Stock image The graph shows the increase of the target drawn in chalk on the Board
Published: Oct.03, 2018 17:18:18
Author: AlexBush
Views: 2
Downloads: 1
File type: image / jpg
File size: 16.78 MB
Orginal size: 6000 x 4000 px
Available sizes:
S
(500 x 333)
M
(1000 x 667)
L
(2000 x 1333)
XL
(6000 x 4000)
EL0
(6000 x 4000)
Level: beginner
Download Image
Image topics:

Similar stock images

stock image colorful business chart on chalkboard

Colorful Business Chart On Chalkboard

3500 × 2333
stock image close up of a business finance graph on a chalkboard

Close Up Of A Business Finance Graph On A Chalkboard

6584 × 5598
stock image The graph shows the increase of the target drawn in chalk on the Board, chart the growth of the ruble

The Graph Shows The Increase Of The Target Drawn In Chalk On The Board, Chart The Growth Of The Ruble

5601 × 3734
stock image Finance business graph on chalkboard economy

Finance Business Graph On Chalkboard Economy

3622 × 2806
stock image Graph showing rise in profits or earnings

Graph Showing Rise In Profits Or Earnings

4752 × 3709
stock image Bar chart showing the collapse of finances in the world. Drawing on a black school blackboard. Dark background.

Bar Chart Showing The Collapse Of Finances In The World. Drawing On A Black School Blackboard. Dark Background.

5515 × 3677
stock image business chart on a blackboard

Business Chart On A Blackboard

3500 × 2333
stock image Graph

Graph

4928 × 3264