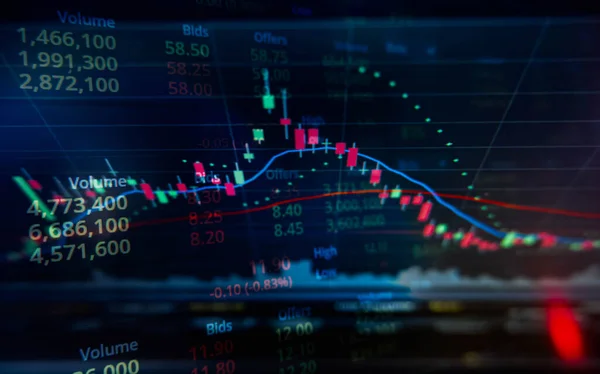
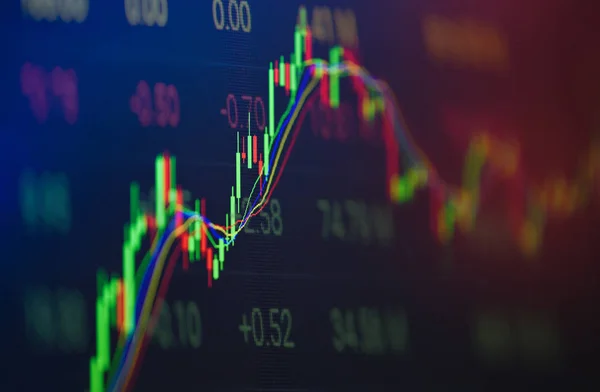
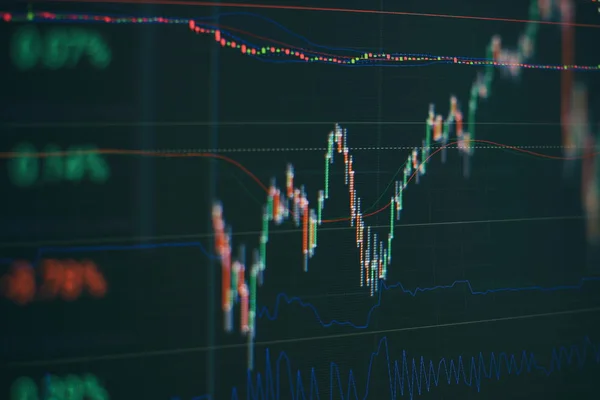
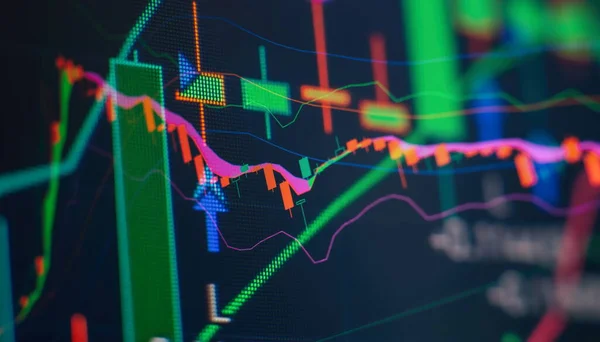
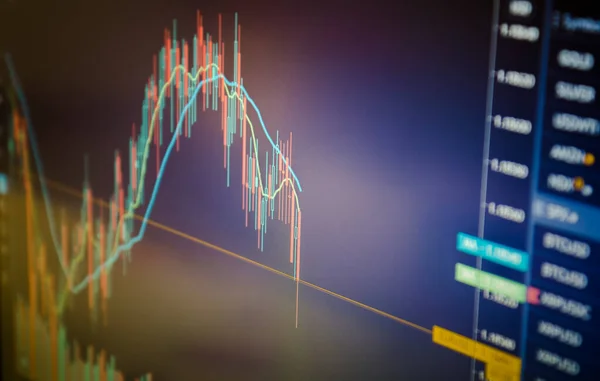
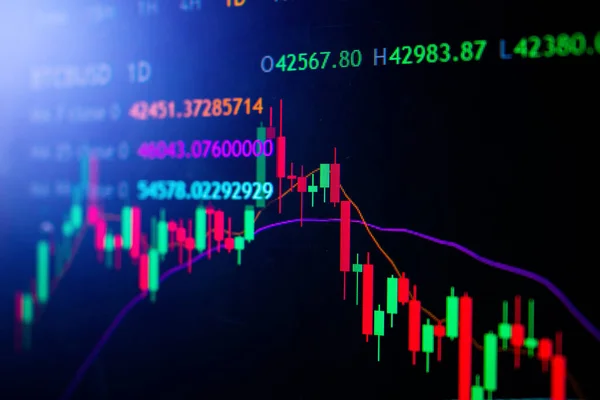
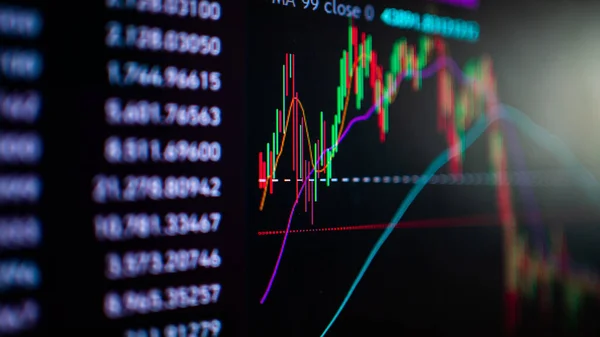
Stock image The market volatility of crypto trading with technical price graph and indicator, red and green candlesticks, for analysis up and downtrend. Stock trading, crypto currency background concept.
Published: Jan.26, 2022 08:21:25
Author: artitwpd
Views: 7
Downloads: 3
File type: image / jpg
File size: 15.46 MB
Orginal size: 7952 x 4472 px
Available sizes:
Level: bronze