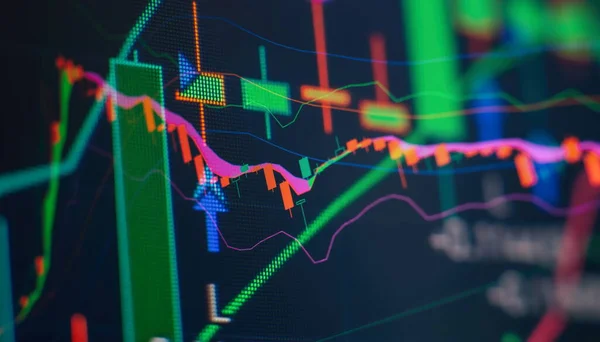
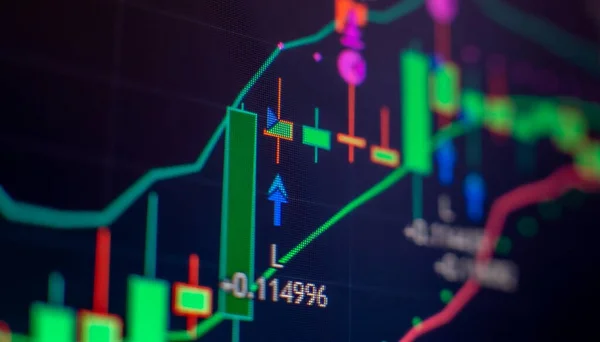
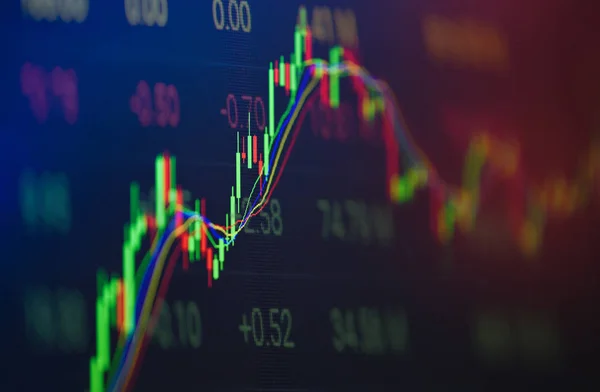
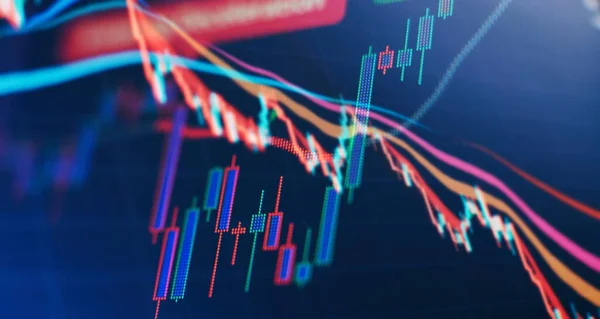
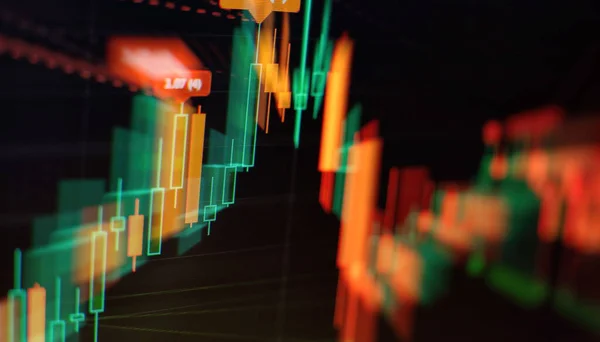
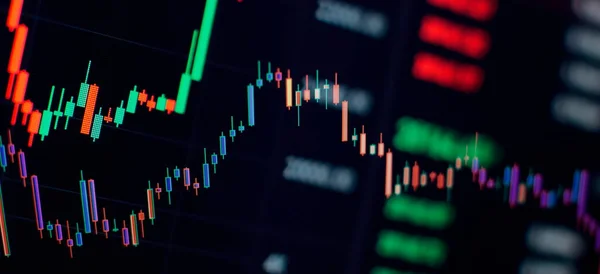
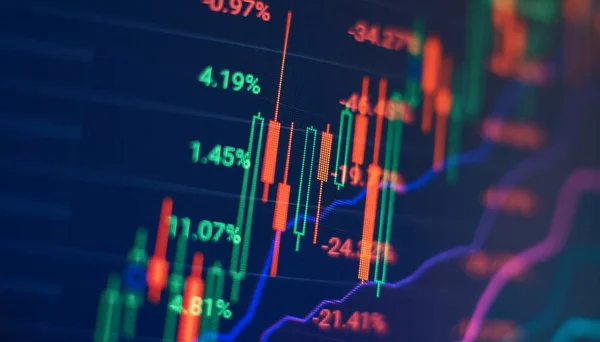
Stock image Trading chart and candlestick chart suitable for financial investment ideas, economic trends, background for all business ideas and art designs
Published: Jul.18, 2022 09:23:21
Author: Maximusdn
Views: 2
Downloads: 0
File type: image / jpg
File size: 14.19 MB
Orginal size: 8268 x 4724 px
Available sizes:
Level: bronze