Home
Images
Vectors
Videos
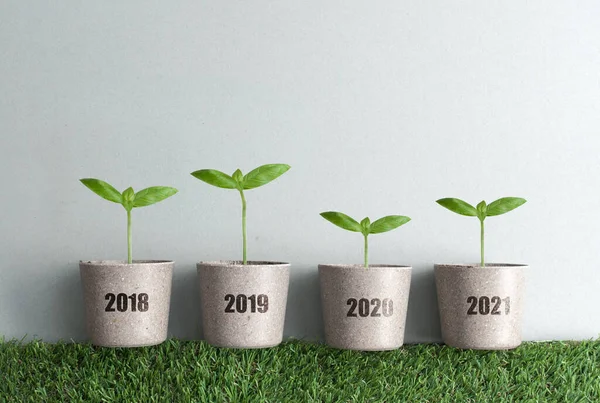
Stock image Year by year business growth comparison concept from 2018 to 2021, new seedlings in plant pots
Published:
Dec.11, 2020 11:42:39
Author:
nupix
Views:
16
Downloads:
1
File type:
image
/
jpg
File size:
4.62 MB
Orginal size:
3894
x
2585
px
Available sizes:
S
(500 x 332)
M
(1000 x 664)
L
(2000 x 1328)
XL
(3894 x 2585)
EL0
(3894 x 2585)
Level:
silver
Download Image
Image topics:
Background
Business
Financial
Label
New
Grass
Sun
Growth
Plant
Line
Arrow
Year
Concept
Support
Clouds
Investment
Crisis
Economy
Forecast
Watering
Virus
Recovery
Falling
Rising
Seedling
Pot
Graph
Chart
Economic
Government
Comparison
Annual
Increase
Slump
Trend
Epidemic
Pandemic
Prediction
2020
Stimulus
2018
Watercan
2019
2021
Covid 19
Covid
Similar stock images
Year By Year Business Growth Comparison Concept From 2018 To 2021, New Seedlings In Plant Pots, Financial Stimulus
3957 × 2789
Business Slump And Recovery Stages Line Graph, With Seedlings And Roots Exposed
4000 × 2656
Year By Year Business Growth Comparison Concept From 2018 To 2021, New Seedlings In Plant Pots, Financial Stimulus
3957 × 2789
Year By Year Business Growth Comparison Concept From 2018 To 2021, New Seedlings In Plant Pots Being Watered With Streams Of Light
3923 × 2519
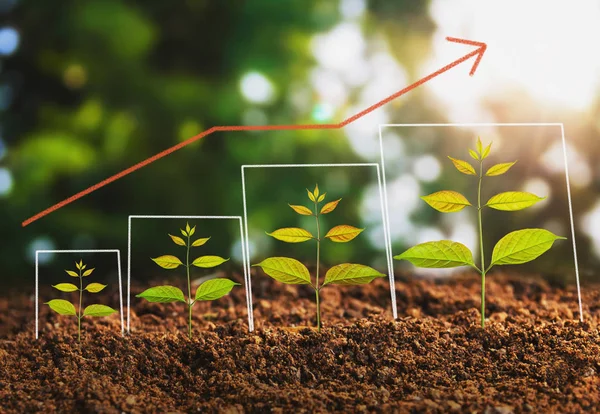
Business Slump And Recovery Stages Chart, With Seedlings And Roots Exposed Inside Plant Pots
4000 × 2832
Year By Year Business Growth Comparison Concept From 2018 To 2021, New Seedlings In Plant Pots
4000 × 2690
Floating Island In The Sky 2019 And 2020. Success Business Concept
5472 × 3648
Business Plant Growing
5000 × 3453