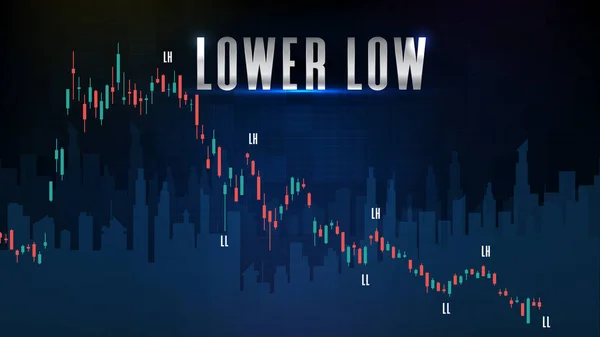
Stock vector abstract futuristic technology background of Chart graph lower low candle stick green and red
Published: Jun.22, 2021 10:05:23
Author: moxumbic
Views: 0
Downloads: 1
File type: vector / eps
File size: 9.01 MB
Orginal size: 6000 x 3375 px
Available sizes:
Level: bronze
Similar stock vectors

Abstract Futuristic Technology Background Of Chart Graph Higher High Candle Stick Green And Red
6000 × 3375