Home
Images
Vectors
Videos
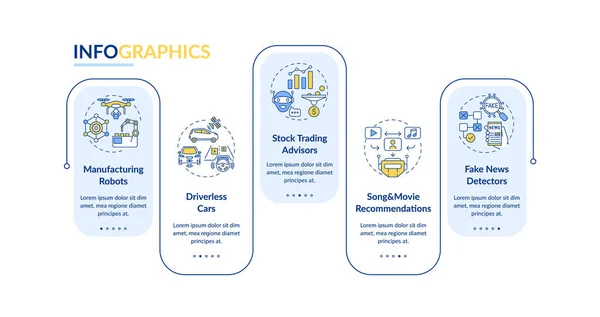
Stock vector AI application 2 vector infographic template. Driverless cars presentation design elements. Data visualization with 5 steps. Process timeline chart. Workflow layout with linear icons
Published:
Nov.05, 2020 08:41:29
Author:
bsd_studio
Views:
4
Downloads:
1
File type:
vector
/
eps
File size:
1.76 MB
Orginal size:
5672
x
3000
px
Available sizes:
S
(500 x 264)
M
(1000 x 529)
L
(2000 x 1058)
XL
(5672 x 3000)
VECT
(5672 x 3000)
EL0
(5672 x 3000)
Level:
silver
Download Vector
Vector topics:
Blue
Vector
Computer
Graphic
Illustration
Design
Artificial
Connected
Technology
Banner
Modern
Concept
Idea
Flow
Icon
Text
Smart
Digital
Flat
Step
Presentation
Rectangle
Intelligence
Web
Template
System
Layout
Application
Outline
Intellect
Cyberspace
Graph
Chart
Process
Scheme
Brochure
Linear
Info
Brain
Diagram
Instructions
Workflow
Ai
Timeline
Neural
Infographic
Artificial Intelligence
Ux
Digital Transformation
Similar stock vectors
E-trash Types Vector Infographic Template. Screens, Household Equipment Presentation Design Elements. Data Visualization With 5 Steps. Process Timeline Chart. Workflow Layout With Linear Icons
6200 × 3500
Bicycle Share Services Vector Infographic Template. Bike Rental Presentation Outline Design Elements. Data Visualization With 5 Steps. Process Timeline Info Chart. Workflow Layout With Line Icons
6000 × 3664
Workstation Design Vector Infographic Template. Sit And Stand Solutions Presentation Design Elements. Data Visualization With 5 Steps. Process Timeline Chart. Workflow Layout With Linear Icons
9374 × 5000
Examples Of Information Systems Rectangle Infographic Template
6000 × 3320
Fighting Screen Addiction Vector Infographic Template. Mute Notifications Presentation Design Elements. Data Visualization With 5 Steps. Process Timeline Chart. Workflow Layout With Linear Icons
5444 × 3000
Energy Safety Parts Vector Infographic Template. Diversification, Emergency Presentation Design Elements. Data Visualization With 5 Steps. Process Timeline Chart. Workflow Layout With Linear Icons
6600 × 3500
Healthcare System In Post Covid Era Rectangle Infographic Template. Data Visualization With 4 Steps. Editable Timeline Info Chart. Workflow Layout With Line Icons. Lato Bold, Regular Fonts Use
6000 × 3737
CVD Causes Vector Infographic Template. High Blood Pressure And Cholesterol Presentation Design Elements. Data Visualization With 5 Steps. Process Timeline Chart. Workflow Layout With Linear Icons
5557 × 3000