photo free
Home Images Vectors Videos

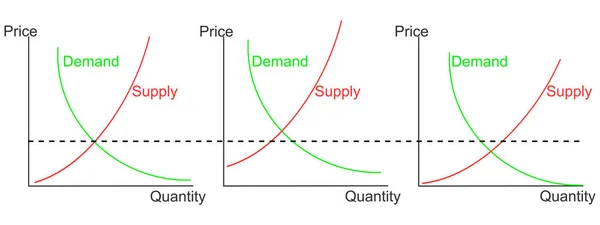
Stock vector Barriers to Entry of demand in monopoly market in economics

Stock vector Barriers to Entry of demand in monopoly market in economics
Published: Apr.15, 2024 03:38:41
Author: Piscine
Views: 1
Downloads: 0
File type: vector / eps
File size: 5.56 MB
Orginal size: 5000 x 4000 px
Available sizes:
S
(500 x 400)
M
(1000 x 800)
L
(2000 x 1600)
XL
(5000 x 4000)
VECT
(5000 x 4000)
EL0
(5000 x 4000)
Level: bronze
Download Vector
Vector topics:

Similar stock vectors

stock vector Demand curve template. Product price and quantity relationships grap. Economics model example isolated on white background. Vector graphic illustration.

Demand Curve Template. Product Price And Quantity Relationships Grap. Economics Model Example Isolated On White Background. Vector Graphic Illustration.

4000 × 4000
stock vector Demand curve examples. Product price and quantity relationship. Representing graphs. Set of economics models isolated on white background. Vector flat illustration.

Demand Curve Examples. Product Price And Quantity Relationship. Representing Graphs. Set Of Economics Models Isolated On White Background. Vector Flat Illustration.

8000 × 3000
stock vector Price formation chart

Price Formation Chart

5040 × 3960
stock vector Demand or supply curve example. Graph representing relationship between product price and quantity. Economics model isolated on white background. Vector outline illustration

Demand Or Supply Curve Example. Graph Representing Relationship Between Product Price And Quantity. Economics Model Isolated On White Background. Vector Outline Illustration

4000 × 4000
stock vector Changes in Supply and Demand

Changes In Supply And Demand

5000 × 4000
stock vector graphic representation of supply curve diagram in economics

Graphic Representation Of Supply Curve Diagram In Economics

5000 × 5000
stock vector Market Disequilibrium of Market Surplus or Excess Supply and market shortage or Excess Demand

Market Disequilibrium Of Market Surplus Or Excess Supply And Market Shortage Or Excess Demand

5000 × 4000
stock vector Demand curve example. Graph representing relationship between product price and quantity. Economics model isolated on white background. Vector graphic illustration

Demand Curve Example. Graph Representing Relationship Between Product Price And Quantity. Economics Model Isolated On White Background. Vector Graphic Illustration

4000 × 4000