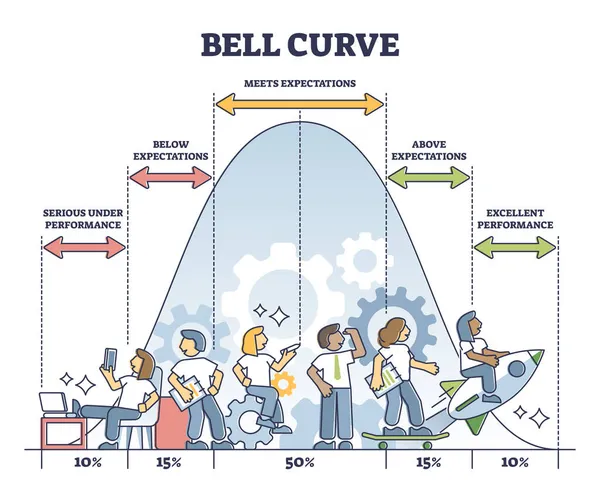
Stock vector Bell curve graphic depicting normal performance distribution outline diagram
Published: Nov.15, 2021 12:43:01
Author: VectorMine
Views: 262
Downloads: 10
File type: vector / eps
File size: 5.67 MB
Orginal size: 4500 x 3750 px
Available sizes:
Level: silver