photo free
Home Images Vectors Videos

Stock vector Candle stick graph chart of stock market investment trading, Bullish point, Bearish point background

Stock vector Candle stick graph chart of stock market investment trading, Bullish point, Bearish point background
Published: Apr.22, 2020 10:53:37
Author: nastudio
Views: 31
Downloads: 1
File type: vector / eps
File size: 0.94 MB
Orginal size: 4800 x 4800 px
Available sizes:
S
(500 x 500)
M
(1000 x 1000)
L
(2000 x 2000)
XL
(4800 x 4800)
VECT
(4800 x 4800)
EL0
(4800 x 4800)
Level: bronze
Download Vector
Vector topics:

Similar stock vectors

stock image Diagram isolated on white background

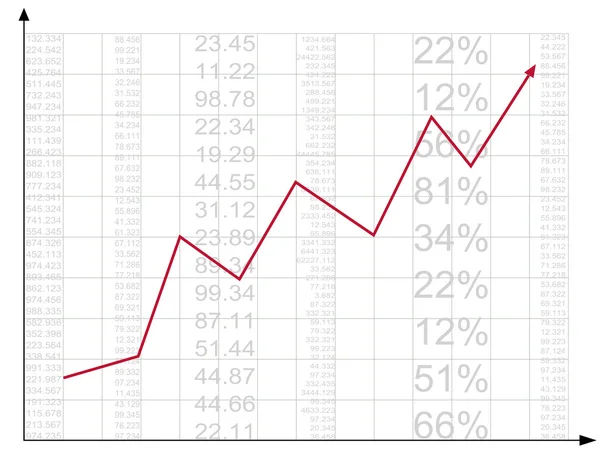
Diagram Isolated On White Background

3088 × 4368
stock vector Finance report

Finance Report

6193 × 4786
stock image Graphs, charts, infographics.

Graphs, Charts, Infographics.

5000 × 3000
stock image Graphs and Charts Report

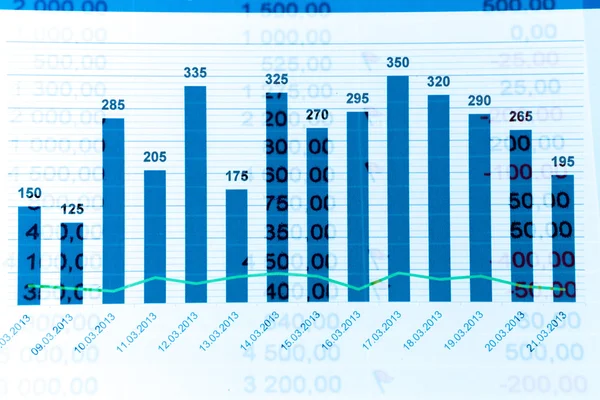
Graphs And Charts Report

5472 × 3648
stock image Growth and falling of the prices at the currency auctions are reflected in financial business

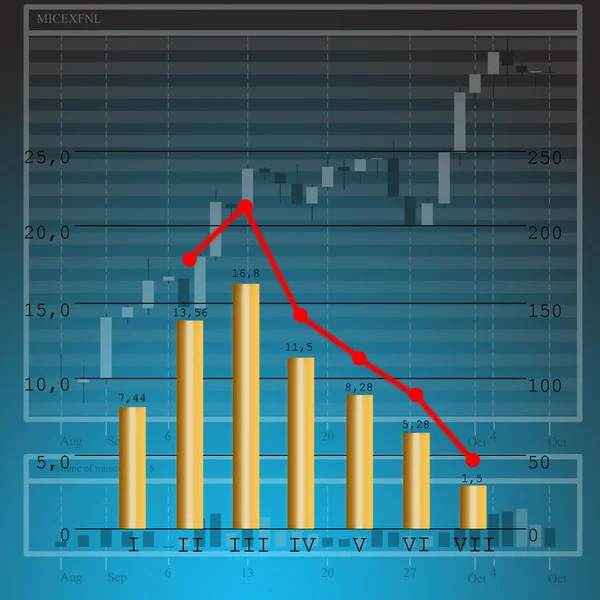
Growth And Falling Of The Prices At The Currency Auctions Are Reflected In Financial Business

3000 × 3000
stock image Sale graphic

Sale Graphic

5500 × 4125
stock vector Business analyzing financial statistics display, data visualization, vector background

Business Analyzing Financial Statistics Display, Data Visualization, Vector Background

6299 × 3543
stock image Pencil line graph

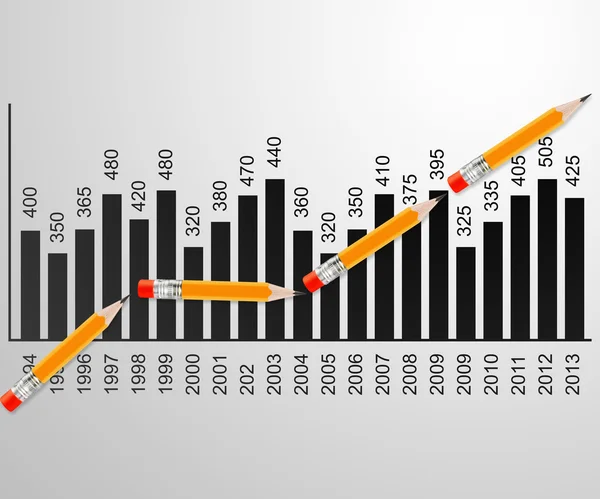
Pencil Line Graph

7087 × 5906