Home
Images
Vectors
Videos
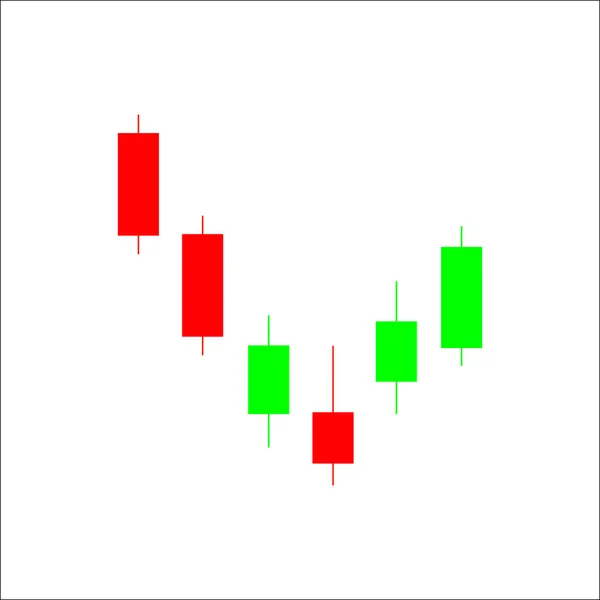
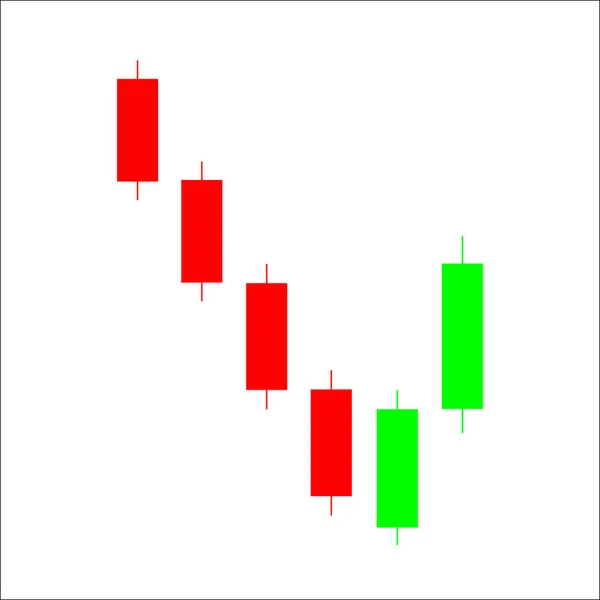
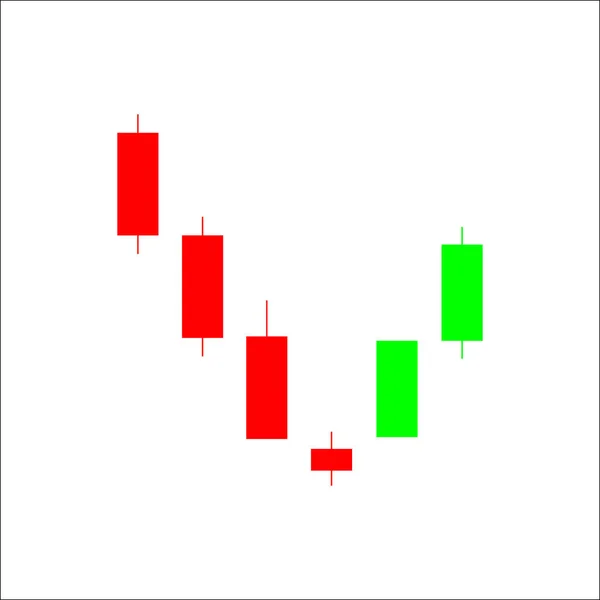
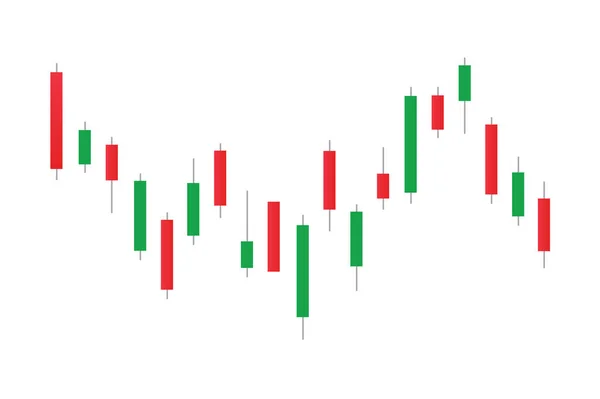
Stock vector Candle trading chart to analyze the trade in the foreign exchange and stock market
Published:
Nov.20, 2018 07:35:16
Author:
Dlyastokiv
Views:
25
Downloads:
0
File type:
vector
/
eps
File size:
2.22 MB
Orginal size:
4171
x
4171
px
Available sizes:
S
(500 x 500)
M
(1000 x 1000)
L
(2000 x 2000)
XL
(4171 x 4171)
VECT
(4171 x 4171)
EL0
(4171 x 4171)
Level:
beginner
Download Vector
Vector topics:
Green
Bar
Red
White
Vector
Background
Money
Illustration
Design
Business
Financial
Market
Trading
Success
Growth
Close
Change
Line
Open
Symbol
Concept
Icon
Wall
Price
Candle
Data
Currency
Exchange
Investment
Finance
Stock
Analyzing
Report
Tail
Loss
Index
Analysis
Graph
Chart
Candlestick
Trade
Profit
Diagram
Forex
Similar stock vectors
Star Bottom Candlestick Chart Pattern. Candle Stick Graph Trading Chart To Analyze The Trade In The Foreign Exchange And Stock Market. Forex Market. Forex Trading. Japanese Candles.
4171 × 4171
Piercing Line Candlestick Chart Pattern. Candle Stick Graph Trading Chart To Analyze The Trade In The Foreign Exchange And Stock Market. Forex Market. Forex Trading. Japanese Candles.
4171 × 4171
Morning Star Candlestick Chart Pattern. Candle Stick Graph Trading Chart To Analyze The Trade In The Foreign Exchange And Stock Market. Forex Market. Forex Trading. Japanese Candles.
4171 × 4171
Shooting Star Candlestick Chart Pattern. Candle Stick Graph Trading Chart To Analyze The Trade In The Foreign Exchange And Stock Market. Forex Market. Forex Trading. Japanese Candles.
4171 × 4171
3d Render, 3d Candlestick Graph Chart On White Background, Business Concept.
4000 × 2700
Raster Flat Candlestick Chart Icon
3529 × 4534
Stock Market Bar Graph, Candlestick Chart, Finance Trade Data, Vector Illustration.
11780 × 7832
Candle Chart Stock Illustration Design
5075 × 5075