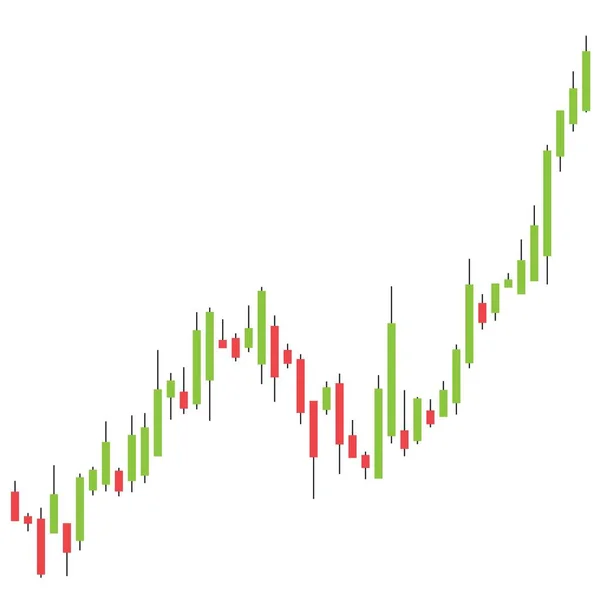
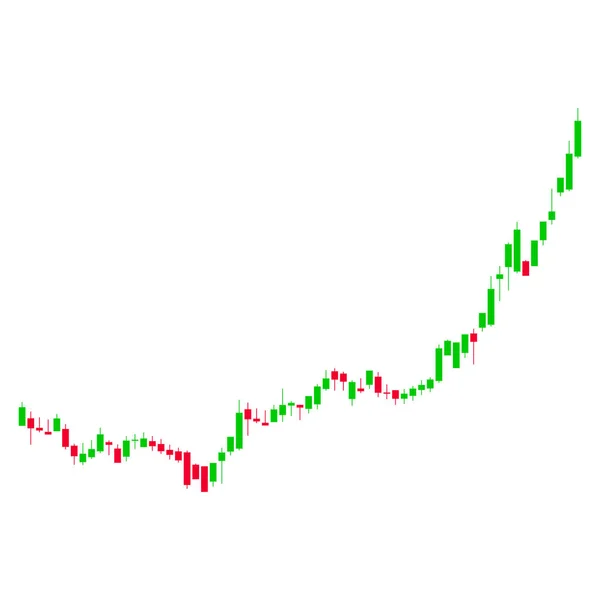
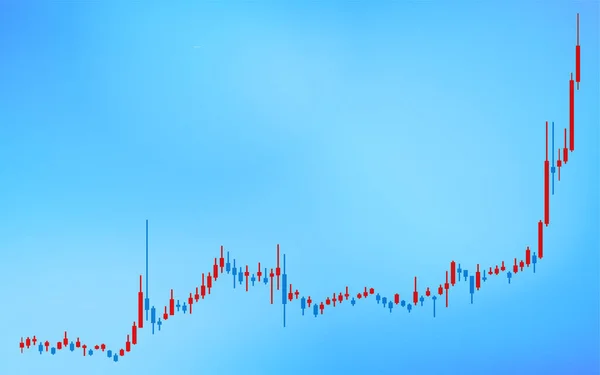
Stock vector Candlestick charts used for stocks, Forex and cryptocurrencies, rising, white background

Published: Apr.13, 2021 06:53:56
Author: t_k_m
Views: 51
Downloads: 5
File type: vector / ai
File size: 0.04 MB
Orginal size: 5334 x 3334 px
Available sizes:
Level: bronze