photo free
Home Images Vectors Videos

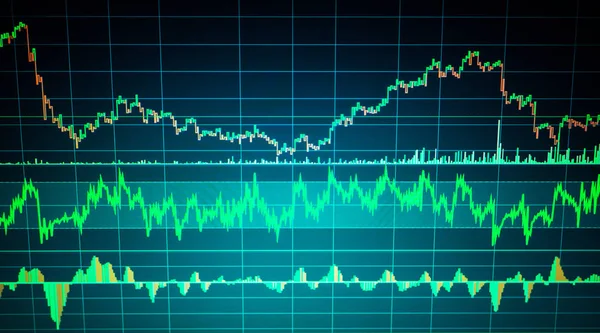
Stock vector Candlestick trading graph isolated on blackboard background, investing stocks market,buy and sell sign candlestick,internet earning study,Making cash on the internet, vector illustration

Stock vector Candlestick trading graph isolated on blackboard   background, investing stocks market,buy and sell sign candlestick,internet earning study,Making cash on the internet, vector illustration
Published: Jul.12, 2021 09:40:23
Author: Phiradet.c
Views: 0
Downloads: 0
File type: vector / eps
File size: 2.01 MB
Orginal size: 8000 x 5327 px
Available sizes:
S
(500 x 333)
M
(1000 x 666)
L
(2000 x 1332)
XL
(8000 x 5327)
VECT
(8000 x 5327)
EL0
(8000 x 5327)
Level: bronze
Download Vector
Vector topics:

Similar stock vectors

stock vector Forex stock chart. Data candle graph.

Forex Stock Chart. Data Candle Graph.

7952 × 3773
stock image Charts of financial instruments with various type of indicators  including volume analysis for professional technical analysis on the monitor

Charts Of Financial Instruments With Various Type Of Indicators Including Volume Analysis For Professional Technical Analysis On The Monitor

4381 × 2966
stock vector Forex stock chart. Data candle graph.

Forex Stock Chart. Data Candle Graph.

6760 × 4438
stock image Graph of candle chart of stock market on black background on digital display

Graph Of Candle Chart Of Stock Market On Black Background On Digital Display

4288 × 2752
stock image Digital screen with  marketing analysis interface. Business and financial success concept. Mock up. 3D Rendering

Digital Screen With Marketing Analysis Interface. Business And Financial Success Concept. Mock Up. 3D Rendering

4500 × 3000
stock image Forex chart for financial analytics

Forex Chart For Financial Analytics

3000 × 3000
stock image Stock market and other finance themes. Financial data on a monitor. Finance data for analysis

Stock Market And Other Finance Themes. Financial Data On A Monitor. Finance Data For Analysis

4608 × 2565
stock image Financial market online chart on screen with red background. Financial, business concept with market candle schedule. Analysis of stock and currency price fluctuations.

Financial Market Online Chart On Screen With Red Background. Financial, Business Concept With Market Candle Schedule. Analysis Of Stock And Currency Price Fluctuations.

5000 × 3333