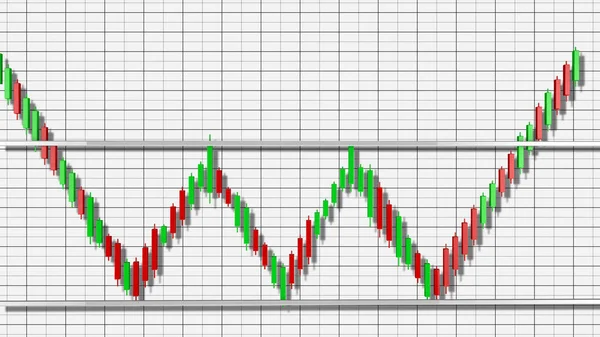
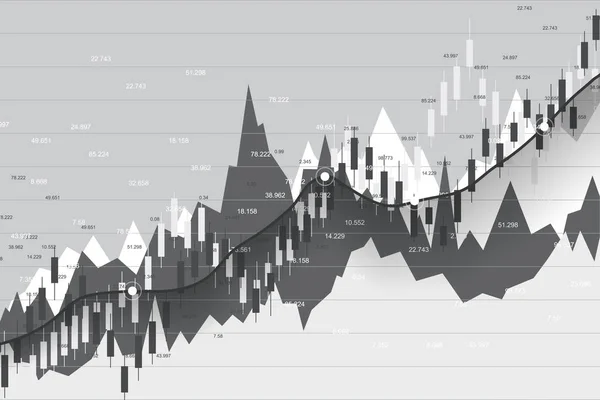
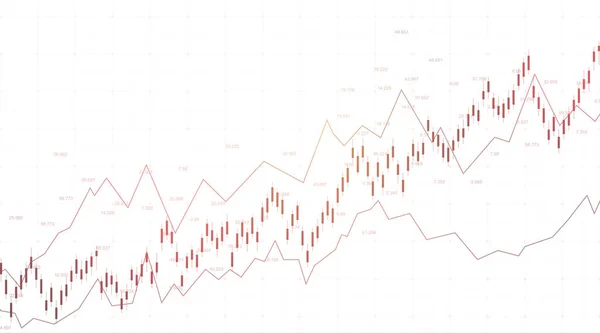
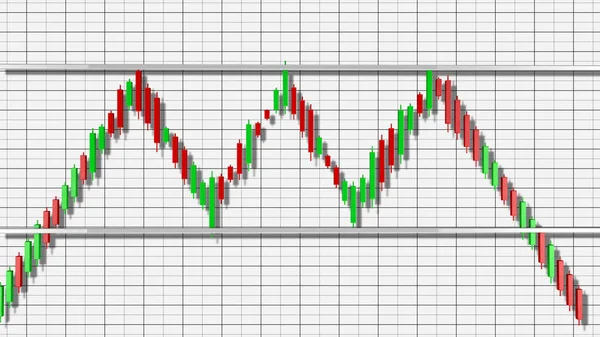
Stock vector Chart and diagram for trade exchange, candles and bar. Vector bar stock graph, diagram trade and chart market, money exchange growth illustration

Published: Aug.04, 2022 12:46:48
Author: 09910190
Views: 1
Downloads: 0
File type: vector / eps
File size: 4.02 MB
Orginal size: 5315 x 5315 px
Available sizes:
Level: beginner