photo free
Home Images Vectors Videos

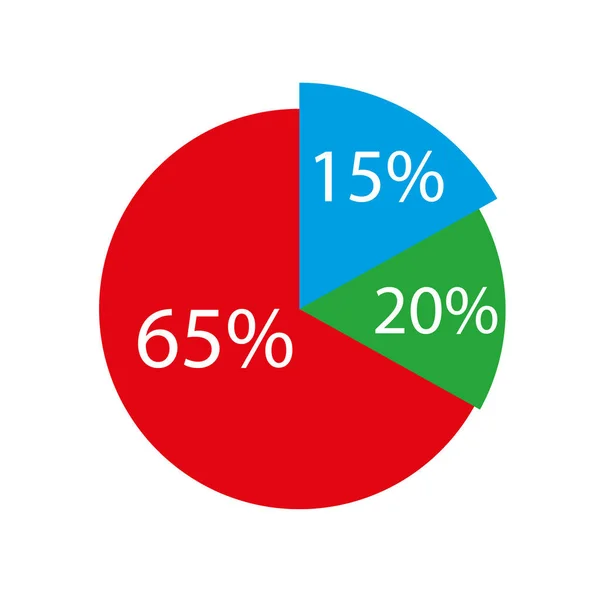
Stock vector Colorful Business Pie Chart.
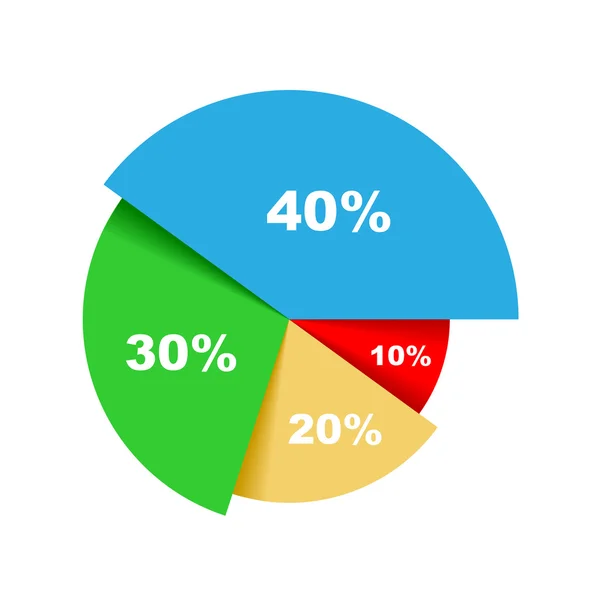
Stock vector Colorful Business Pie Chart.
Published: Jul.16, 2014 09:44:35
Author: in8finity
Views: 67
Downloads: 2
File type: vector / eps
File size: 0.28 MB
Orginal size: 4000 x 4000 px
Available sizes:
S
(500 x 500)
M
(1000 x 1000)
L
(2000 x 2000)
XL
(4000 x 4000)
VECT
(4000 x 4000)
EL0
(4000 x 4000)
Level: silver
Download Vector
Vector topics:

Similar stock vectors

stock vector Isometric cycle diagram for infographics in 3 parts. Vector chart can be used for graph, report, presentation, brochure, web design. 3d pie.

Isometric Cycle Diagram For Infographics In 3 Parts. Vector Chart Can Be Used For Graph, Report, Presentation, Brochure, Web Design. 3d Pie.

5976 × 4183
stock vector Isometric cycle diagram for infographics in 7 parts. Vector chart can be used for graph, report, presentation, brochure, web design. 3d pie.

Isometric Cycle Diagram For Infographics In 7 Parts. Vector Chart Can Be Used For Graph, Report, Presentation, Brochure, Web Design. 3d Pie.

5976 × 4183
stock vector Isometric cycle diagram for infographics in 3 parts. Vector chart can be used for graph, report, presentation, brochure, web design. 3d pie.

Isometric Cycle Diagram For Infographics In 3 Parts. Vector Chart Can Be Used For Graph, Report, Presentation, Brochure, Web Design. 3d Pie.

5976 × 4183
stock vector Isometric cycle diagram for infographics in 4 parts. Vector chart can be used for graph, report, presentation, brochure, web design. 3d pie.

Isometric Cycle Diagram For Infographics In 4 Parts. Vector Chart Can Be Used For Graph, Report, Presentation, Brochure, Web Design. 3d Pie.

5976 × 4183
stock vector modern vector abstract pie chart infographics elements.can be used for workflow layout, diagram, number options, web design. illustration

Modern Vector Abstract Pie Chart Infographics Elements.can Be Used For Workflow Layout, Diagram, Number Options, Web Design. Illustration

4000 × 4000
stock vector 48% Percentage, 48 Percentage Circle diagram infographic

48% Percentage, 48 Percentage Circle Diagram Infographic

5014 × 4000
stock vector Isometric cycle diagram for infographics in 3 parts. Vector chart can be used for graph, report, presentation, brochure, web design. 3d pie.

Isometric Cycle Diagram For Infographics In 3 Parts. Vector Chart Can Be Used For Graph, Report, Presentation, Brochure, Web Design. 3d Pie.

5976 × 4183
stock vector Isometric cycle diagram for infographics in 6 parts. Vector chart can be used for graph, report, presentation, brochure, web design. 3d pie.

Isometric Cycle Diagram For Infographics In 6 Parts. Vector Chart Can Be Used For Graph, Report, Presentation, Brochure, Web Design. 3d Pie.

5976 × 4183