Home
Images
Vectors
Videos
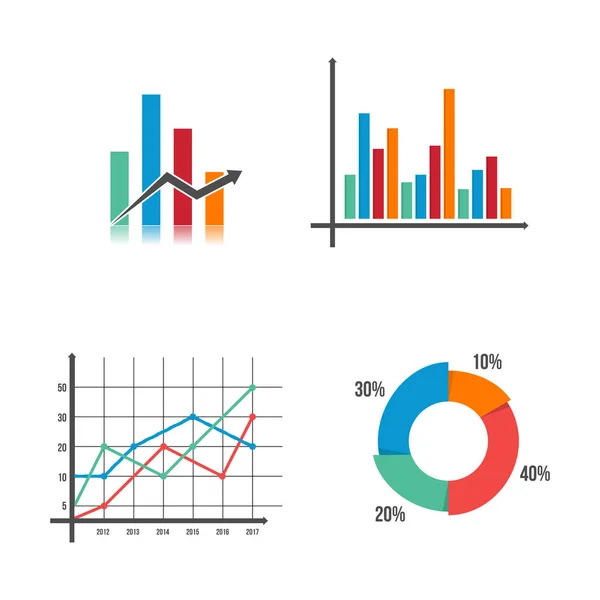
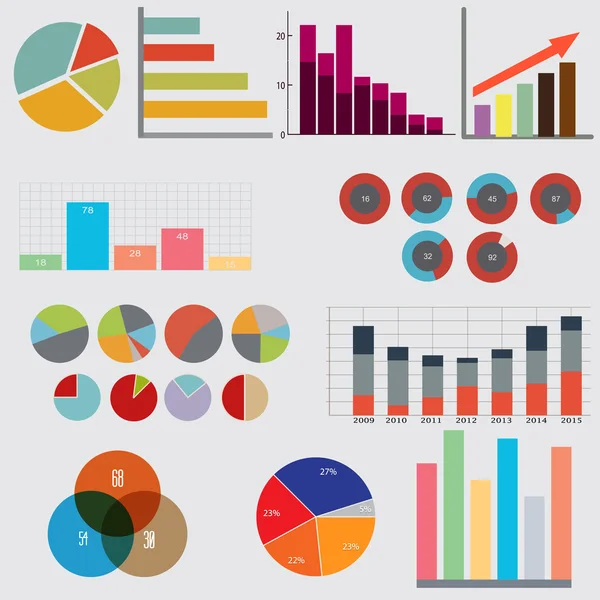
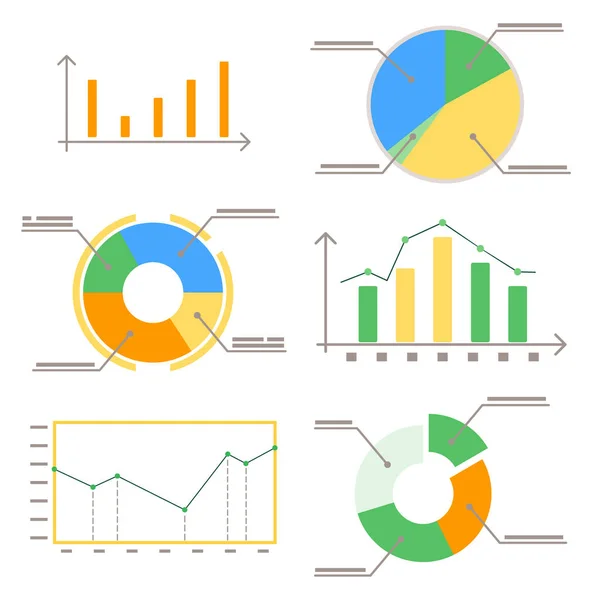
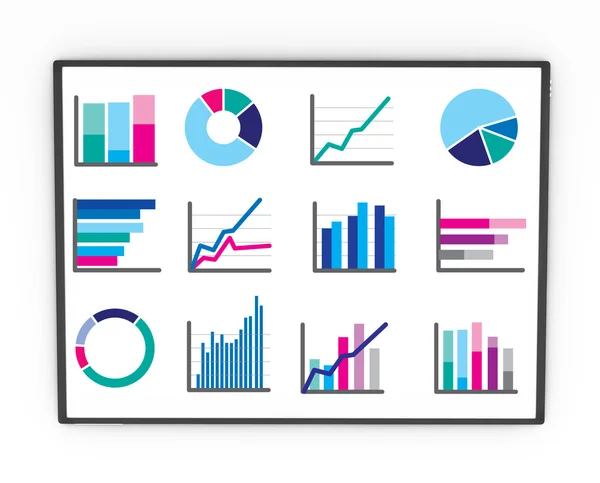
Stock vector Data tools finance diagram and graphic. Chart and graphic, business diagram data finance, graph report, information data statistic, infographic analysis tools vector illustration
Published:
Dec.25, 2017 12:44:35
Author:
doeland
Views:
61
Downloads:
0
File type:
vector
/
eps
File size:
2.17 MB
Orginal size:
3000
x
3000
px
Available sizes:
S
(500 x 500)
M
(1000 x 1000)
L
(2000 x 2000)
XL
(3000 x 3000)
VECT
(3000 x 3000)
EL0
(3000 x 3000)
Level:
beginner
Download Vector
Vector topics:
Vector
Background
Money
Graphic
Element
Illustration
Design
Set
Business
Financial
Sign
Growth
Abstract
Light
Instrument
Clock
Symbol
Creative
Concept
Idea
Icon
Lamp
Flat
Data
Development
Tool
Document
Information
Finance
Marketing
Plan
Analyzing
Report
Research
Analysis
Graph
Chart
Hourglass
Coin
Result
Progress
Info
Diagram
Statistic
Analytic
Infographic
Similar stock vectors
Set Analysis Bar Graph
5000 × 5000
Data Tools Finance Diagram And Graphic. Chart And Graphic, Business Diagram Data Finance, Graph Report, Information Data Statistic, Infographic Analysis Tools Vector Illustration
3000 × 3000
Infographic Elements. Business Diagrams And Graphics
5000 × 5000
Analytics Data Diagrams, Business Visualization
4941 × 5002
Touchpad Or Touchscreen Flat Device From Above Analysing Data
6752 × 5448
Business Data Market Elements Dot Bar Pie Charts Diagrams And Graphs Flat Icons Set Isolated Vector Illustration. Eps 10
4800 × 4183
Graph And Pie Chart Business Marketing With Harmony Color Collection Vector Illustration
6000 × 4000
Graphs Flat Icons Set
4500 × 4500