photo free
Home Images Vectors Videos

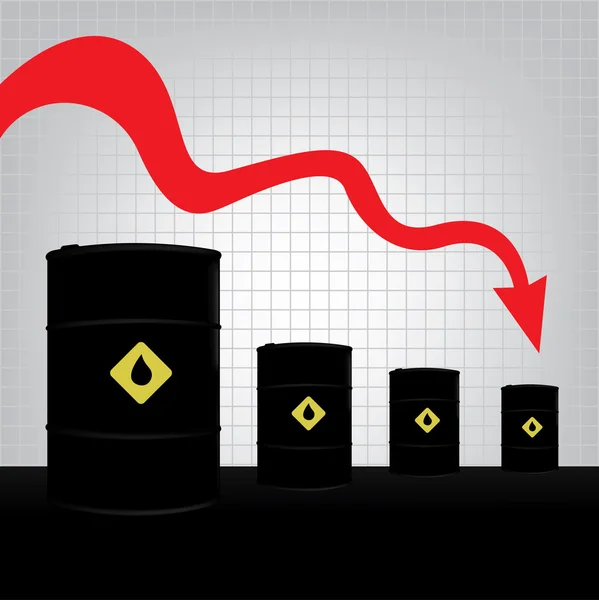
Stock vector Decline chart diagram
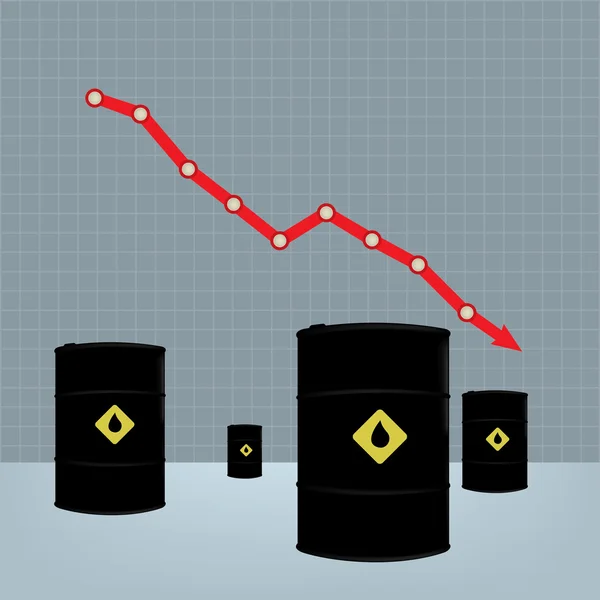
Stock vector Decline chart diagram
Published: Mar.16, 2015 17:52:16
Author: mangulica
Views: 68
Downloads: 2
File type: vector / eps
File size: 1.69 MB
Orginal size: 4134 x 4134 px
Available sizes:
S
(500 x 500)
M
(1000 x 1000)
L
(2000 x 2000)
XL
(4134 x 4134)
VECT
(4134 x 4134)
EL0
(4134 x 4134)
Level: beginner
Download Vector
Vector topics:

Similar stock vectors

stock image Concept of rising oil prices. Barrel of oil and a graph with an arrow up, on a gray background. World crisis. Business. Background.

Concept Of Rising Oil Prices. Barrel Of Oil And A Graph With An Arrow Up, On A Gray Background. World Crisis. Business. Background.

6000 × 4000
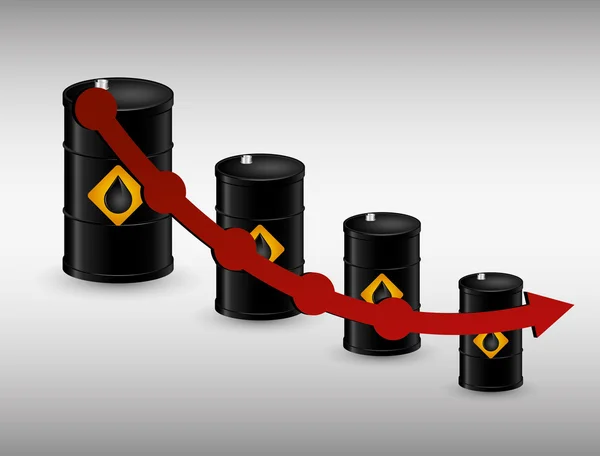
stock vector Oil price fall graph

Oil Price Fall Graph

4134 × 2953
stock vector oil price fell in the global market. white background.

Oil Price Fell In The Global Market. White Background.

5000 × 5000
stock vector Petroleum and oil prices business

Petroleum And Oil Prices Business

5315 × 4046
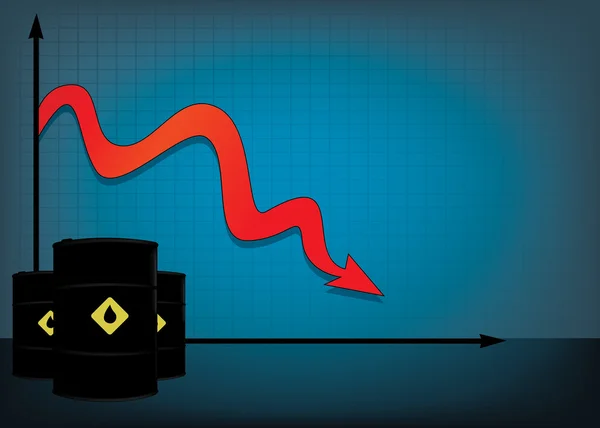
stock vector Oil barrels on Decline chart diagram

Oil Barrels On Decline Chart Diagram

4134 × 4140
stock vector Petroleum and oil prices business

Petroleum And Oil Prices Business

4983 × 5315
stock vector Flat illustration about Oil price, petroleum and gas concepts

Flat Illustration About Oil Price, Petroleum And Gas Concepts

5315 × 5315
stock vector Oil barrels on Decline chart diagram

Oil Barrels On Decline Chart Diagram

4134 × 4134