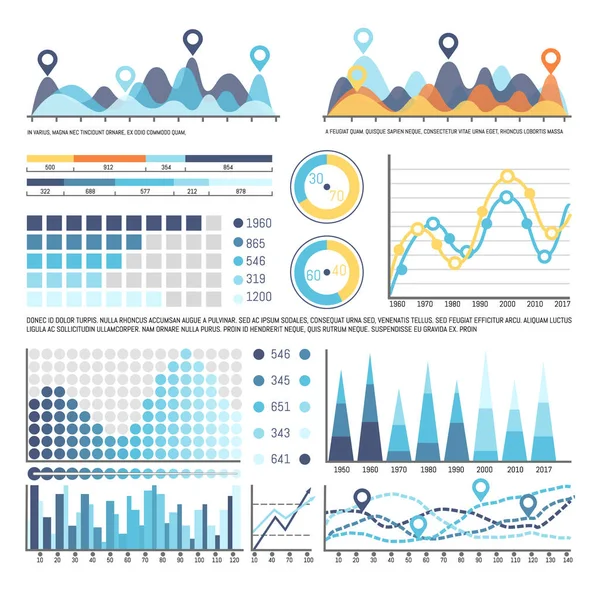
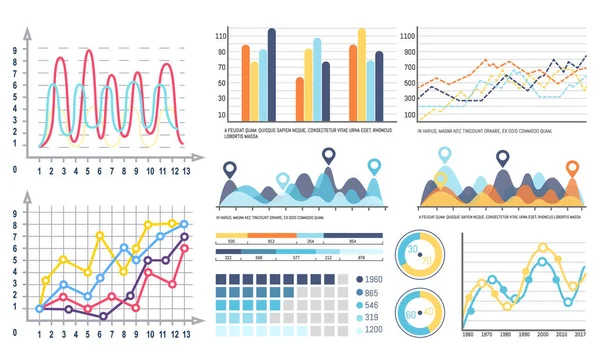
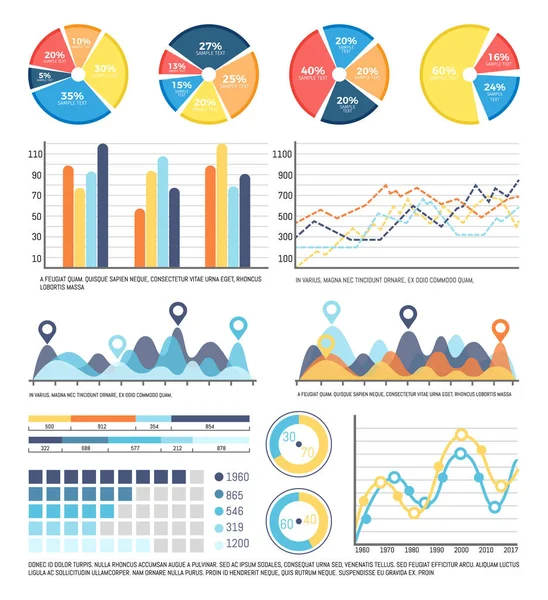
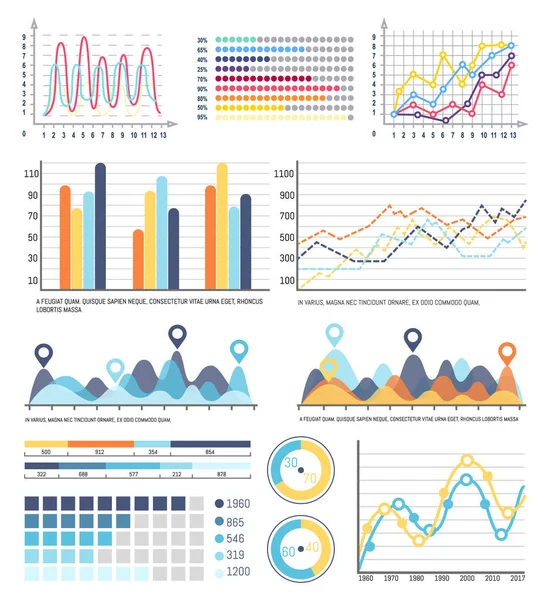
Stock vector Diagram and Infographics with Segments Explanation
Published: Dec.14, 2018 17:00:34
Author: robuart
Views: 34
Downloads: 3
File type: vector / eps
File size: 1.04 MB
Orginal size: 4594 x 4999 px
Available sizes:
Level: gold