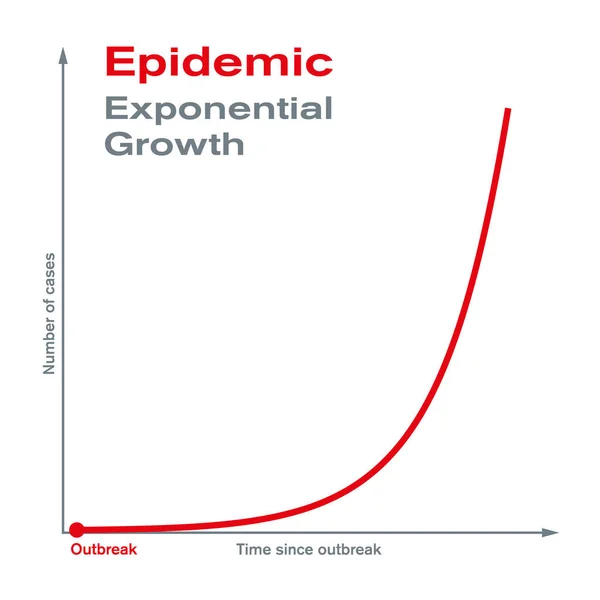
Stock vector Epidemic. Exponential growth. Rapid spread and epidemic outbreak of a disease to a large number of people in a short period of time. The number of cases increases exponentially. Illustration. Vector.
Published: Mar.20, 2020 12:35:56
Author: Furian
Views: 17
Downloads: 3
File type: vector / eps
File size: 2.71 MB
Orginal size: 6000 x 6000 px
Available sizes:
Level: silver
Similar stock vectors


Concept Of Coronavirus Or Covid 19 Outbreak Effect On World Or Global Economic Growth. White Background.
8334 × 8334