Home
Images
Vectors
Videos
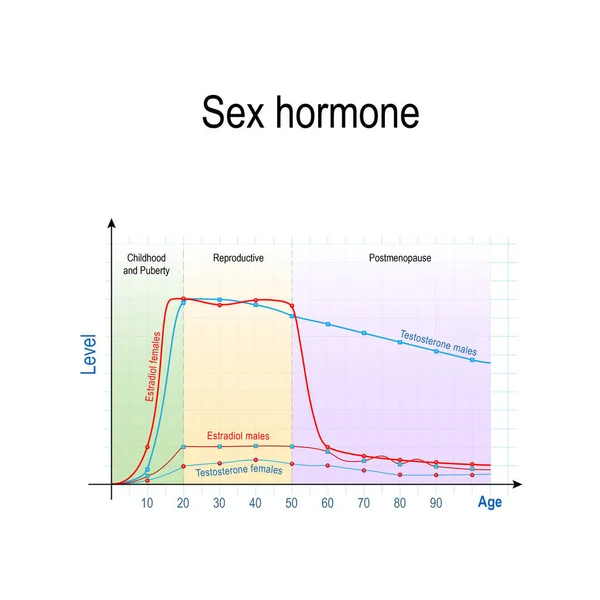
Stock vector Female hormones lifestyle graph. Estrogen end progesterone diagram in the woman body in infancy, puberty, reproductive years, perimenopause and menopause maximum and minimum level flat vector
Published:
Oct.02, 2023 21:55:54
Author:
Pikovit
Views:
8
Downloads:
2
File type:
vector
/
eps
File size:
0.4 MB
Orginal size:
6349
x
2997
px
Available sizes:
S
(500 x 236)
M
(1000 x 472)
L
(2000 x 944)
XL
(6349 x 2997)
VECT
(6349 x 2997)
EL0
(6349 x 2997)
Level:
bronze
Download Vector
Vector topics:
Vector
Curve
Illustration
High
Human
Female
Women
Health
Blood
Medical
Childhood
Year
Early
Age
Test
Range
Delivery
Peak
Level
Rise
Mother
Breastfeeding
Changes
Birth
Growing
Low
Graph
Value
Chart
Poster
Fertility
Produce
Info
Diagram
Increase
Plateau
Phase
Relative
Infancy
Trimester
Progesterone
Puberty
Reproductive
Menopause
Estrogen
Hormones
Hormonal
Lifecycle
Infographic
Perimenopause
Similar stock vectors
Sex Hormones And Ageing. Levels Of Testosterone For Males And Females, And Estradiol For Men And Women. Chart Of Sex Hormone Production In Human. Vector Illustration For Educational, Biological, Science And Medical Use
3338 × 3338
Estrogen Decline In Women And Man
4725 × 3465
Hormone Production Chart
4922 × 3610
Human Fertility Concept
5268 × 3374
Sex Hormone Production
4725 × 3369
Female Hormones. Beautiful Medical Vector Illustration. Scientific, Educational And Popular-scientific Concept. Female Endocrine System. Human Anatomy. Human Silhouette. Hormones
5000 × 5000
Male Reproductive Hormones
4168 × 4168
Menopause Chart. Estrogen Level And Aging. Fluctuation Of Hormones That Occurs During Menopause. Menopause As A Stage In Women's Lives When Their Bodies Lose The Ability To Produce Enough Hormones That Keep The Body Balanced And Healthy. Vector Illus
2842 × 2842