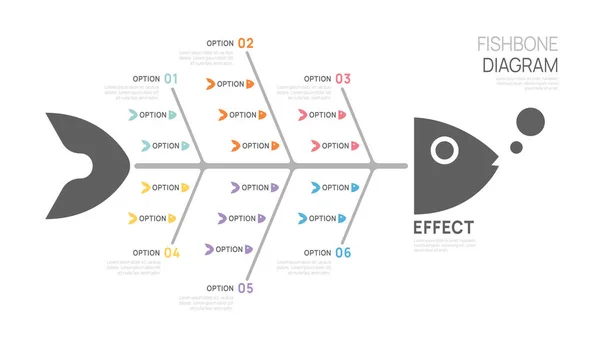
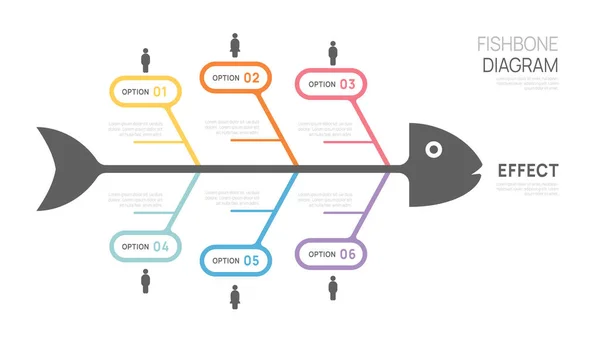
Stock vector Fishbone Diagram Cause and Effect Template for business Timeline infographics. vector design.
Published: Aug.22, 2023 12:07:00
Author: pongsuwan
Views: 5
Downloads: 0
File type: vector / eps
File size: 6.84 MB
Orginal size: 6200 x 3500 px
Available sizes:
Level: silver
Similar stock vectors
Fishbone Diagram Cause And Effect Template For Business Timeline Infographics. Vector Design.
6200 × 3500

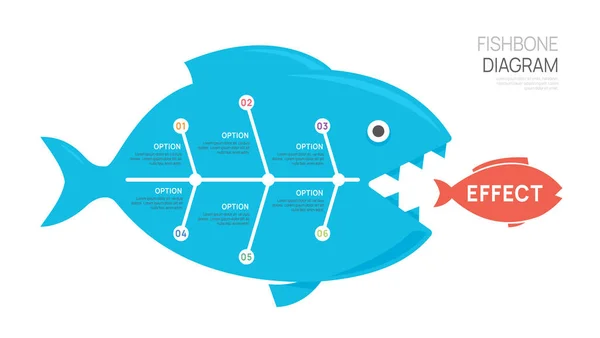
Fishbone Diagram Cause And Effect Template For Business Timeline Infographics. Vector Design.
6200 × 3500
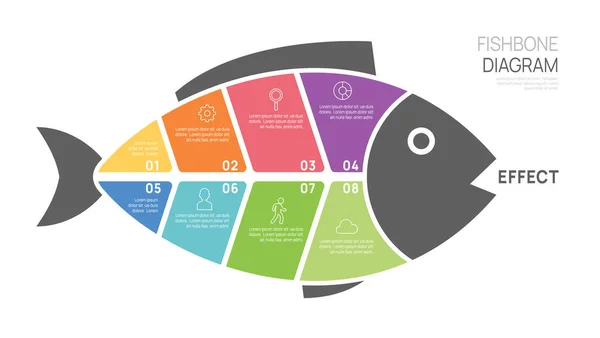
Fishbone Diagram Cause And Effect Template For Business Timeline Infographics. Vector Design.
6200 × 3500