Home
Images
Vectors
Videos
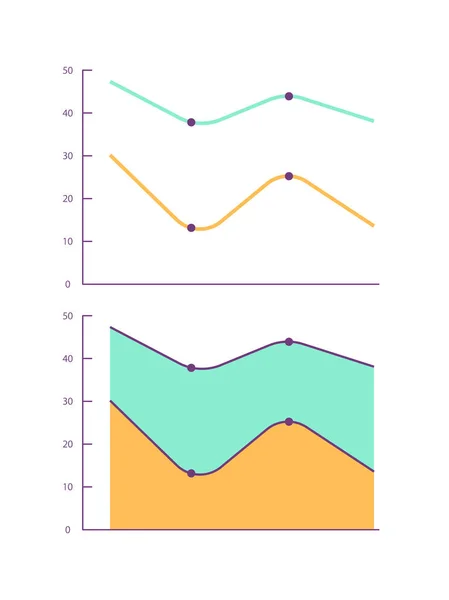
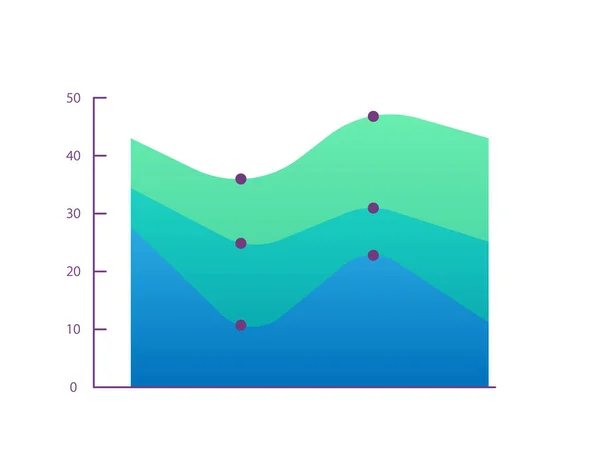
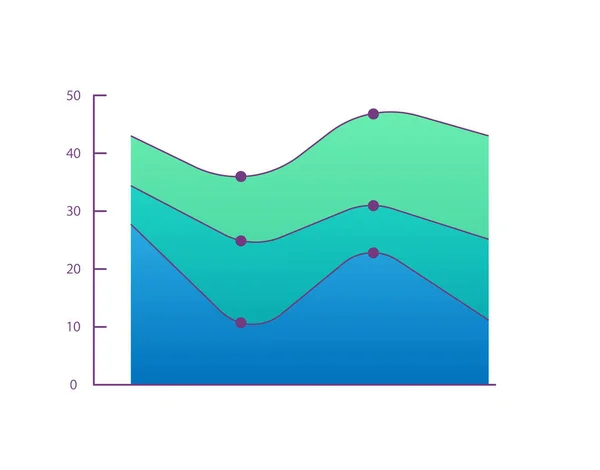
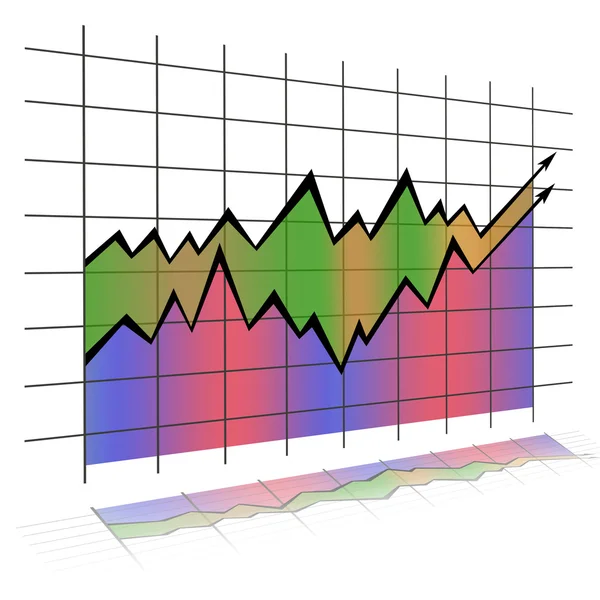
Stock vector Flat dashboard, set of ui infographic elements
Published:
Apr.05, 2017 07:15:24
Author:
gn8
Views:
67
Downloads:
2
File type:
vector
/
eps
File size:
1.02 MB
Orginal size:
5000
x
5000
px
Available sizes:
S
(500 x 500)
M
(1000 x 1000)
L
(2000 x 2000)
XL
(5000 x 5000)
VECT
(5000 x 5000)
EL0
(5000 x 5000)
Level:
silver
Download Vector
Vector topics:
Bar
Activity
Vector
Background
Curve
Element
Illustration
Design
Business
Market
Sign
Abstract
Line
Style
Wave
Symbol
Flat
Data
Simple
Information
Web
Finance
Template
Page
Marketing
Website
Dots
Dashboard
Research
Analysis
Graph
Chart
Parabolic
Interface
Diagram
Calculation
Stats
Statistic
Trend
Histogram
Analyst
Chalkboard
Minimalistic
Interactive
Gaussian
Hyperbola
Similar stock vectors
Infographic Chart Vector Template. Annual Statistics Curve Graph. Market Data Diagram. Workflow Graph Design.
7778 × 4045
Line And Area Infographic Charts Design Template Set. Magnitude Change Over Time. Profit Margin. Visual Data Presentation. Editable Diagrams Collection. Myriad Pro-Bold, Regular Fonts Used
3747 × 5000
Multi-layered Area Infographic Chart Design Template. Changes Over Interval. Stock Performance. Editable Horizontal Filled Infochart. Visual Data Presentation. Myriad Pro-Bold, Regular Fonts Used
5000 × 3870
Stacked Area Infographic Chart Design Template. Three Groups Value. Trade Indicators. Editable Horizontal Lines Infochart. Visual Data Presentation. Myriad Pro-Bold, Regular Fonts Used
5000 × 3921
Diagram
6350 × 6350
Trouble Regression Chart Icon, Isometric Style
5000 × 5000
Layered Area Infographic Chart Design Template. Inflation Rate. Economic Research. Editable Infochart With Horizontal Bar Graphs. Visual Data Presentation. Myriad Pro-Bold, Regular Fonts Used
5000 × 3870
Curved Lines On A Graph Paper Showing The Concept Of Sine Wave
7600 × 8000