photo free
Home Images Vectors Videos

Stock vector Forex Trading Indicators vector illustration on blue background. Online trading signals to buy and sell currency concept. Buy and sell indices for forex trade on the candlestick chart graphic design.
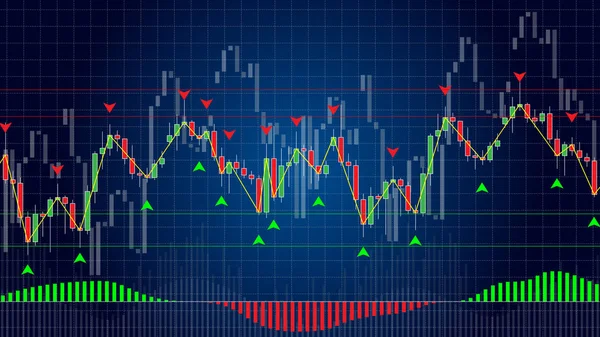
Stock vector Forex Trading Indicators vector illustration on blue background. Online trading signals to buy and sell currency concept. Buy and sell indices for forex trade on the candlestick chart graphic design.
Published: Jul.11, 2018 12:31:52
Author: AleksOrel
Views: 755
Downloads: 12
File type: vector / eps
File size: 4.93 MB
Orginal size: 6667 x 3750 px
Available sizes:
S
(500 x 281)
M
(1000 x 562)
L
(2000 x 1125)
XL
(6667 x 3750)
VECT
(6667 x 3750)
EL0
(6667 x 3750)
Level: silver
Download Vector
Vector topics:

Similar stock vectors

stock vector Forex Trading Indicators vector illustration on dark background. Online trading signals to buy and sell currency concept. Buy and sell indices for forex trade on the candlestick chart graphic design.

Forex Trading Indicators Vector Illustration On Dark Background. Online Trading Signals To Buy And Sell Currency Concept. Buy And Sell Indices For Forex Trade On The Candlestick Chart Graphic Design.

6667 × 3750
stock image Candle stick graph chart with indicator showing bullish point or

Candle Stick Graph Chart With Indicator Showing Bullish Point Or

6016 × 4016
stock image Digital screen with stock charts. Business trading concept. Mock up. 3D Rendering

Digital Screen With Stock Charts. Business Trading Concept. Mock Up. 3D Rendering

4500 × 3000
stock vector Financial trade concept. Stock market and exchange. Candle stick graph chart.

Financial Trade Concept. Stock Market And Exchange. Candle Stick Graph Chart.

6159 × 4168
stock image business financial trading ideas concept stock market finance monitor chart candle stick chart with indicator monitor screen

Business Financial Trading Ideas Concept Stock Market Finance Monitor Chart Candle Stick Chart With Indicator Monitor Screen

7848 × 3368
stock image Candle stick graph chart with indicator showing bullish point or

Candle Stick Graph Chart With Indicator Showing Bullish Point Or

5730 × 3820
stock vector Stock market or forex trading chart with indicator in graphic design concept, vector illustration

Stock Market Or Forex Trading Chart With Indicator In Graphic Design Concept, Vector Illustration

8000 × 5001
stock vector Stock market candlestick chart vector illustration. Buy and sell indicators for trade on the chart. Financial diagram with assets values moving up and down.

Stock Market Candlestick Chart Vector Illustration. Buy And Sell Indicators For Trade On The Chart. Financial Diagram With Assets Values Moving Up And Down.

5500 × 3234