Home
Images
Vectors
Videos
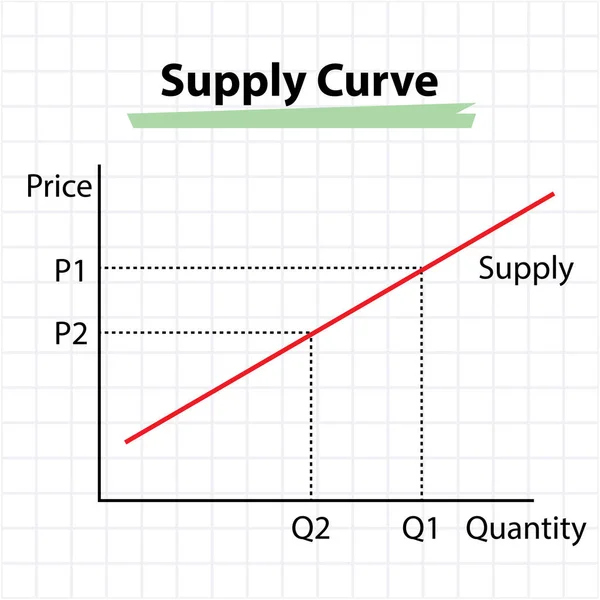
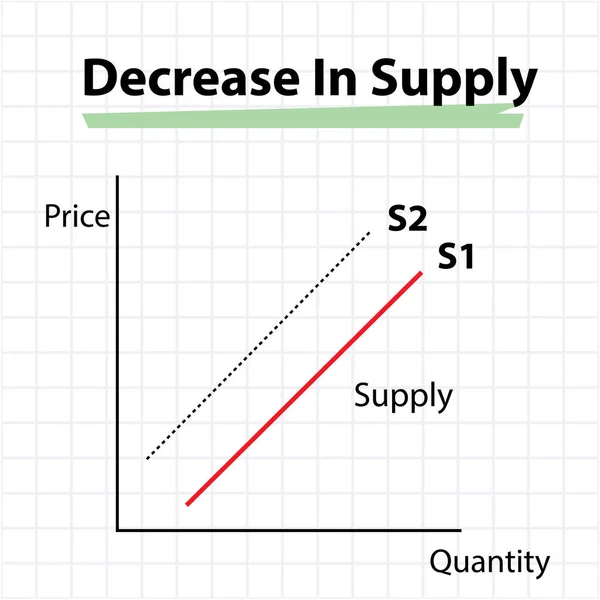
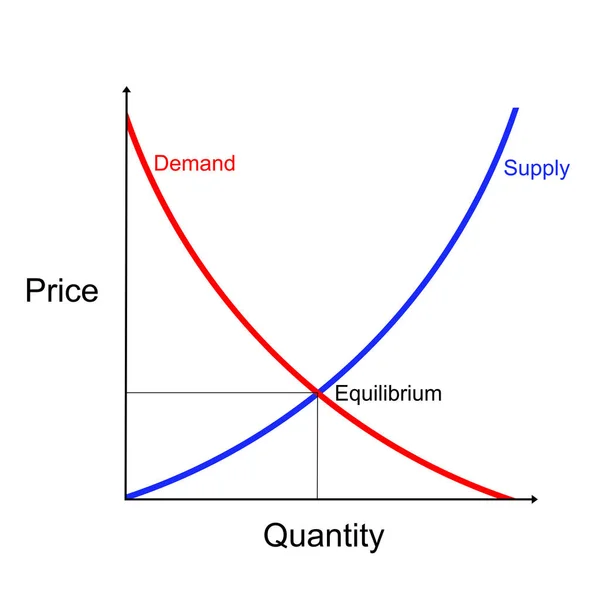
Stock vector graphic representation of supply curve diagram in economics
Published:
Nov.10, 2021 11:15:14
Author:
zizou07
Views:
1
Downloads:
0
File type:
vector
/
eps
File size:
5.24 MB
Orginal size:
5000
x
5000
px
Available sizes:
S
(500 x 500)
M
(1000 x 1000)
L
(2000 x 2000)
XL
(5000 x 5000)
VECT
(5000 x 5000)
EL0
(5000 x 5000)
Level:
beginner
Download Vector
Vector topics:
Vector
Background
Curve
Graphic
Illustration
Design
Business
Financial
Art
Abstract
Board
Supply
Line
Symbol
Concept
Icon
Service
Price
Product
Flat
Data
Law
Simple
Drawing
Science
Economics
Good
Graph
Chart
Linear
Diagram
Mathematic
Chalk
Quantity
Definition
Demand
Axis
Shift
Period
Function
Chalkboard
Representation
Coordinates
Movements
Producers
Microeconomics
Supply Curve
Similar stock vectors
Supply Curve Diagram - Price And Quantity Concept
4167 × 4167
Demand Curve Example. Graph Representing Relationship Between Product Price And Quantity. Economics Model Isolated On White Background. Vector Graphic Illustration
4000 × 4000
Increase In Supply Diagram - Price And Quantity Concept
4167 × 4167
Graphic Representation Of Supply Curve Diagram In Economics
5000 × 5000
Decrease In Supply - Price And Quantity Concept
4167 × 4167
Graphic Representation Of Supply Curve Diagram In Economics
5000 × 5000
Supply And Demand Curves Diagram Showing Equilibrium Point
9000 × 9000
Demand Curve Example. Graph Representing Relationships Between Product Price And Quantity. Economics Model Diagram Isolated On White Background. Vector Graphic Illustration
4000 × 4000