photo free
Home Images Vectors Videos

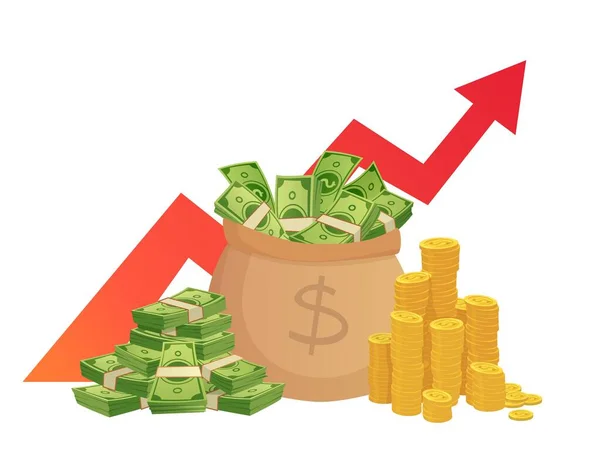
Stock vector Growing cash graph. Pile of cash, money value red rising graph arrow and financial growth diagram vector illustration

Stock vector Growing cash graph. Pile of cash, money value red rising graph arrow and financial growth diagram vector illustration
Published: Nov.18, 2019 12:04:50
Author: tartila.stock.gmail.com
Views: 5
Downloads: 1
File type: vector / eps
File size: 0.99 MB
Orginal size: 6236 x 4009 px
Available sizes:
S
(500 x 321)
M
(1000 x 643)
L
(2000 x 1286)
XL
(6236 x 4009)
VECT
(6236 x 4009)
EL0
(6236 x 4009)
Level: silver
Download Vector
Vector topics:

Similar stock vectors

stock vector Cartoon savings value growth. Money profit increase, profitable investments chart with red graph arrow and cash pile vector illustration

Cartoon Savings Value Growth. Money Profit Increase, Profitable Investments Chart With Red Graph Arrow And Cash Pile Vector Illustration

5676 × 4404
stock vector Cash loss graph. Finance inflation schedule, money loss and decrease in income vector illustration

Cash Loss Graph. Finance Inflation Schedule, Money Loss And Decrease In Income Vector Illustration

6236 × 4009
stock vector Profit performance graph

Profit Performance Graph

6553 × 3815
stock image Lots of money and golden dollar symbol

Lots Of Money And Golden Dollar Symbol

2500 × 1875
stock vector Pile of money dollar notes and dollar bag and money increase value arrow. on white background. stock market and business icon

Pile Of Money Dollar Notes And Dollar Bag And Money Increase Value Arrow. On White Background. Stock Market And Business Icon

3563 × 3481
stock vector business growth graph with arrow and coins. vector illustration

Business Growth Graph With Arrow And Coins. Vector Illustration

4000 × 4000
stock vector visible of dollar notes and increase value arrow. on white background. stock market icons

Visible Of Dollar Notes And Increase Value Arrow. On White Background. Stock Market Icons

2654 × 2296
stock vector Bad finance graph. Loss of financial savings, inflation schedule and money loss. Bankruptcy vector illustration

Bad Finance Graph. Loss Of Financial Savings, Inflation Schedule And Money Loss. Bankruptcy Vector Illustration

6455 × 3873