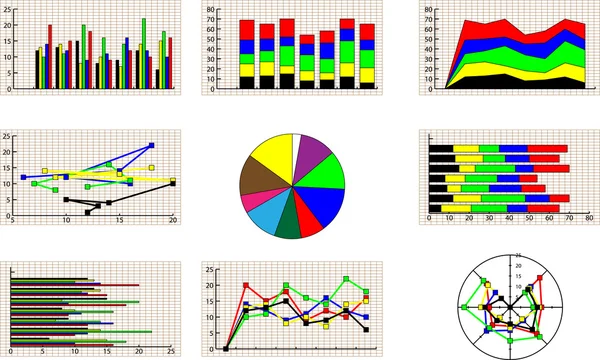
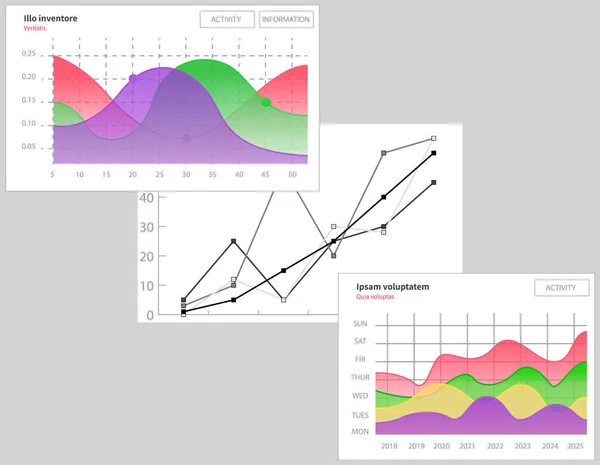
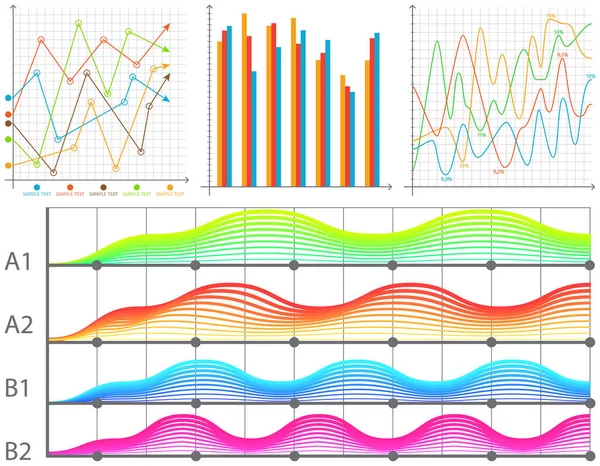
Stock vector Intelligent technology hud interactive panel. Data screen with charts. Annual financial report
Published: Apr.04, 2022 12:30:09
Author: robuart
Views: 5
Downloads: 0
File type: vector / eps
File size: 0.55 MB
Orginal size: 5000 x 3890 px
Available sizes:
Level: gold
Similar stock vectors
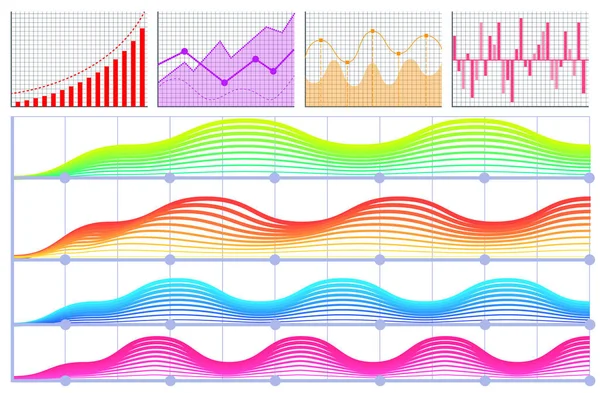
Intelligent Technology Hud Interactive Panel. Data Screen With Charts. Annual Financial Report
5000 × 3283