Home
Images
Vectors
Videos
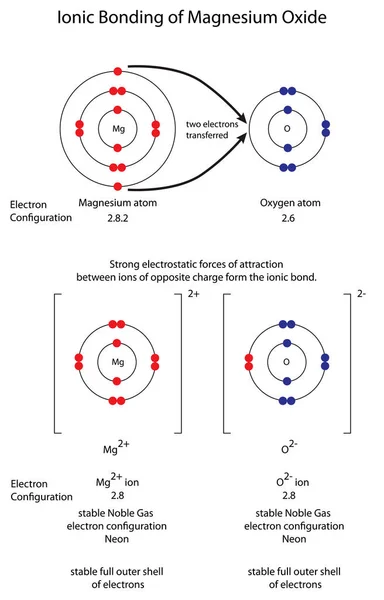
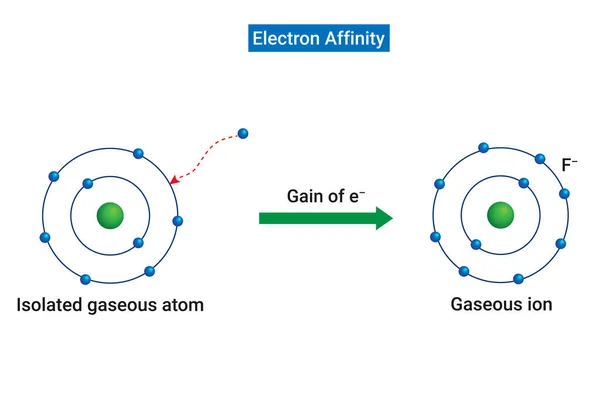
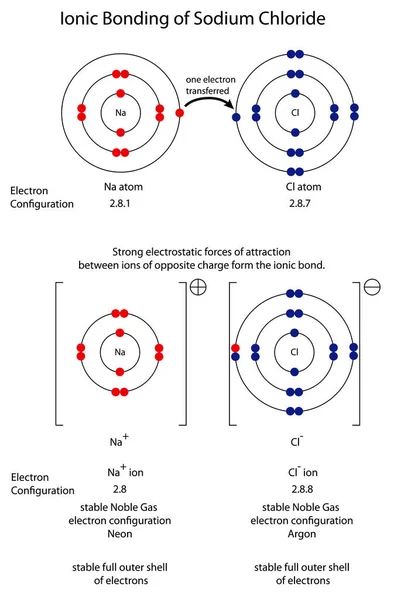
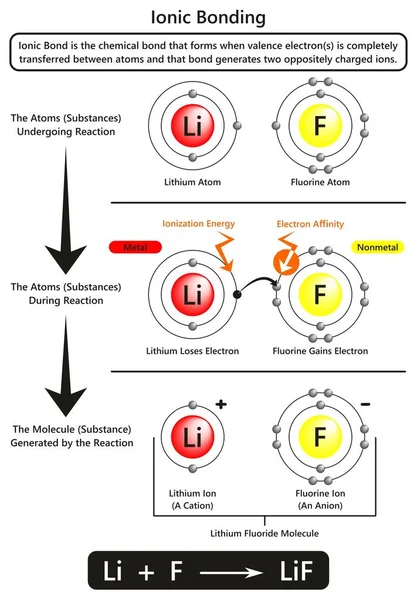
Stock vector Ionic bonding infographic diagram with example of Ionic bond between lithium and fluorine atoms showing ionization energy and electron affinity for chemistry science education
Published:
Aug.20, 2018 11:34:43
Author:
udaix
Views:
596
Downloads:
7
File type:
vector
/
eps
File size:
0.73 MB
Orginal size:
1697
x
2441
px
Available sizes:
S
(348 x 500)
M
(695 x 1000)
L
(1390 x 2000)
XL
(1697 x 2441)
VECT
(1697 x 2441)
EL0
(1697 x 2441)
Level:
bronze
Download Vector
Vector topics:
Vector
Illustration
Energy
Form
Power
Transfer
Formula
Structure
Education
Chemical
Science
Gain
Solvent
Chemistry
Substance
Shell
Atom
Attraction
Electron
Particle
Process
Force
Polar
Formation
Reaction
Bond
Diagram
Rule
Generate
Compound
Molecule
Molecular
Example
Lose
Affinity
Configuration
Ion
Lithium
Ionization
Fluoride
Ionic
Dissociation
Valence
Electrostatic
Fluorine
Endothermic
Infographic
Undergoing
Octet
Dissociate
Similar stock vectors
Metallic Bonding Is A Type Of Chemical Bonding That Arises From The Electrostatic Attractive Force Between Conduction Electrons
7817 × 3703
Diagram To Show Ionic Bonding In Magnesium Oxide MgO
3205 × 5000
Electron Affinity : Energy Released When An E- Is Added To The Valence Shell Of An Isolated Gaseous Atom.
10417 × 7084
Diagram To Show Ionic Bonding In Sodium Chloride
3289 × 5000
Write And Balance Chemical Equation Infographic Diagram With Example Of Reaction Of Methane With Oxygen As Reactants And Result Of Carbon Dioxide And Water As Products For Chemistry Science Education
2742 × 1525
Periodicity In Atomic Properties Infographic Diagram Including Ionization Energy Electron Affinity Atomic Radius Metallic And Nonmetallic Characters For Chemistry Science Education Poster Vector
2801 × 2214
Ionic Bond And Electrostatic Attraction From Chemical Bonding Outline Diagram
6000 × 3333
Tendency Of Cation And Anion To Discharge.
5209 × 3542