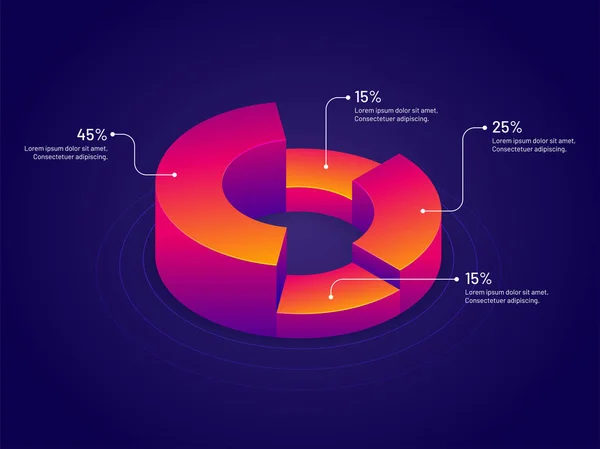
Stock vector Isometric illustration of pie chart with different percentage increase and decrease in different business sectors on blue background.
Published: Aug.17, 2018 10:30:58
Author: alliesinteract
Views: 4
Downloads: 0
File type: vector / eps
File size: 1.13 MB
Orginal size: 6901 x 5175 px
Available sizes:
Level: gold