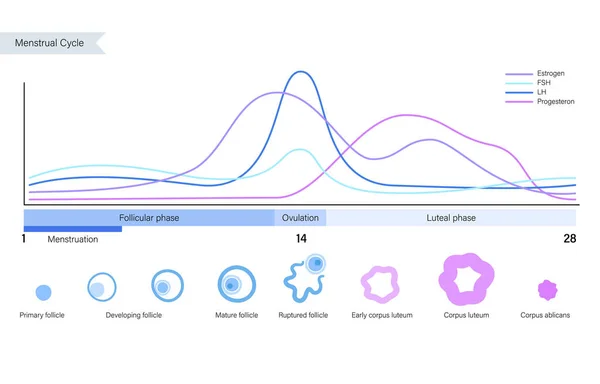
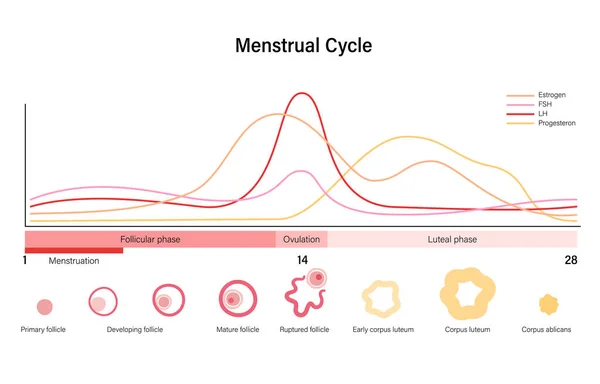
Stock vector Menstrual cycle graphic. Hormones in the female body. Estradiol, progesterone, FSH, and LH value in the woman body in follicular phase, ovulation and luteal phase maximum and minimum level flat vector

Published: Oct.02, 2023 21:22:45
Author: Pikovit
Views: 13
Downloads: 3
File type: vector / eps
File size: 0.39 MB
Orginal size: 6585 x 2997 px
Available sizes:
Level: bronze
Similar stock vectors
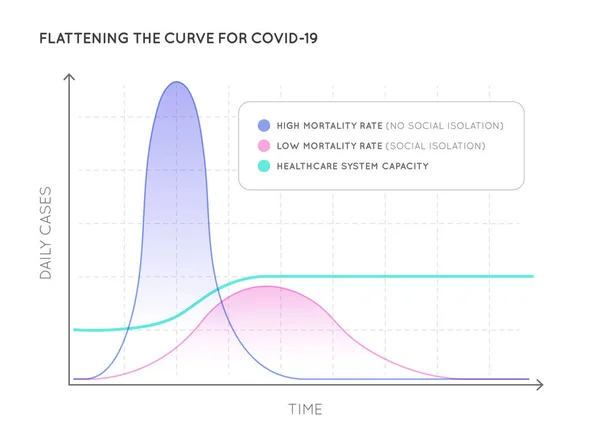
Flattening The Curve For COVID-19 (2019-nCOV) Coronavirus. Act Early To Stop Pandemic Disease.
5239 × 3800