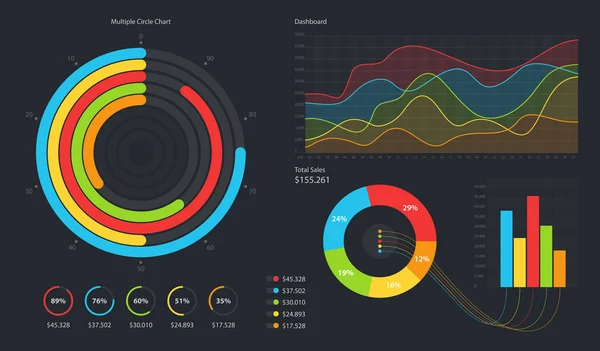
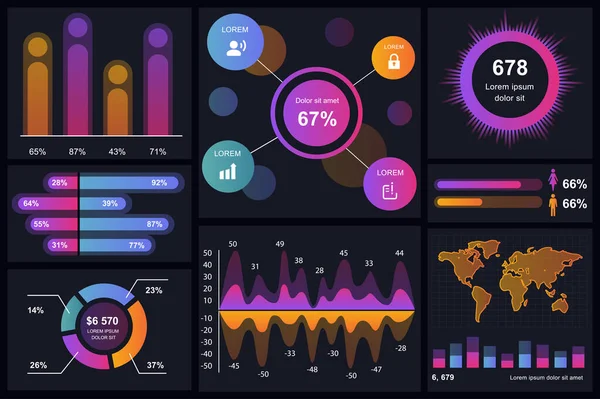
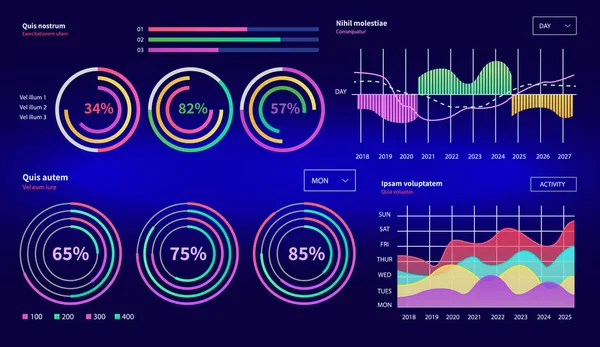
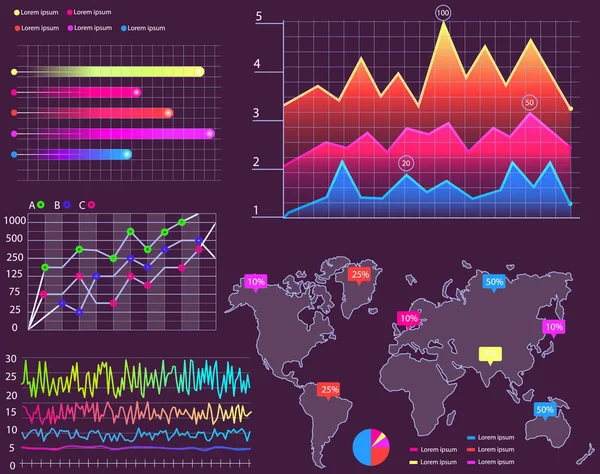
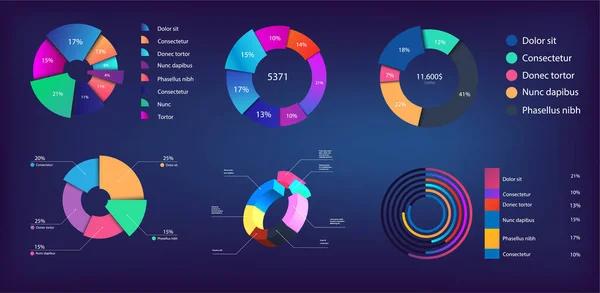
Stock vector Neon gradient pie chart, infographic collection for reports and presentations, UI, WEB. Mockups circle infochart and Pie charts. 3D, and flat infographics. Modern Pie chart set. Vector illustration
Published: Jul.06, 2021 12:14:37
Author: sergeybitos.mail.ru
Views: 2
Downloads: 0
File type: vector / eps
File size: 1.27 MB
Orginal size: 4135 x 2022 px
Available sizes:
Level: bronze