Home
Images
Vectors
Videos
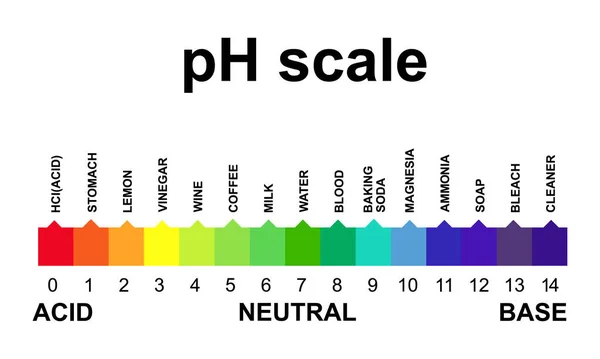
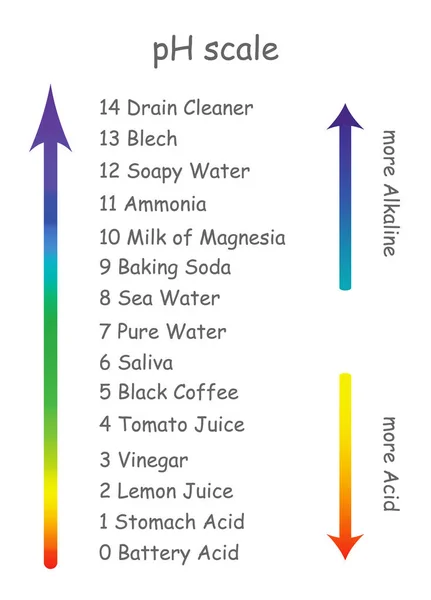
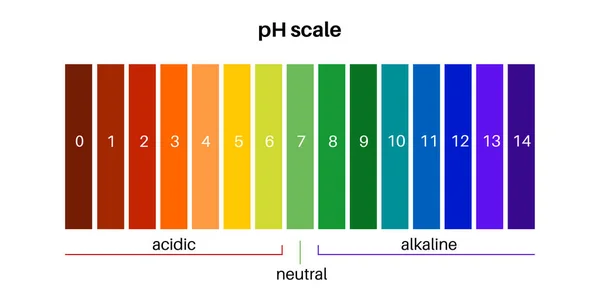
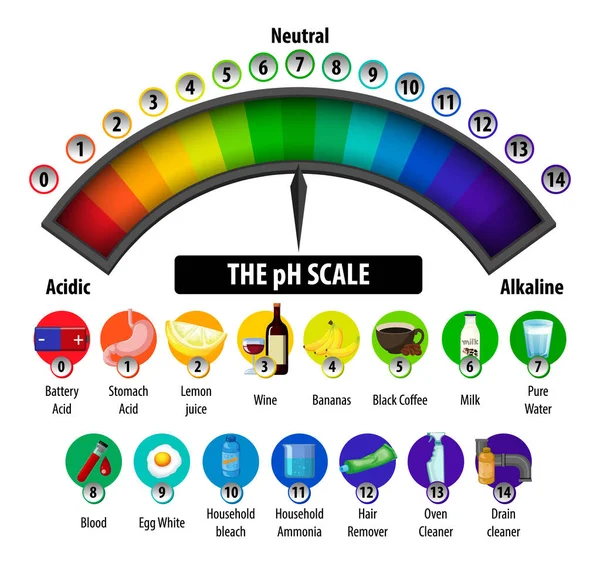
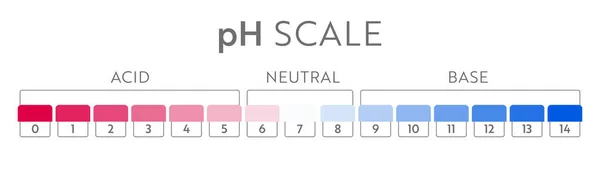
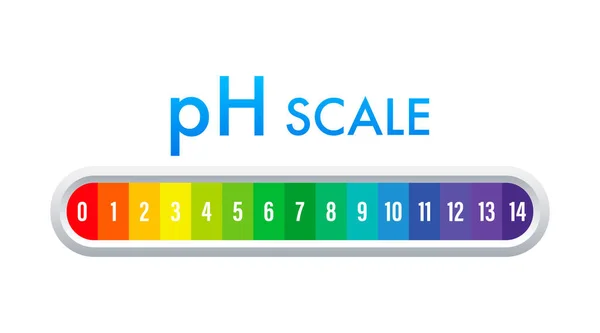
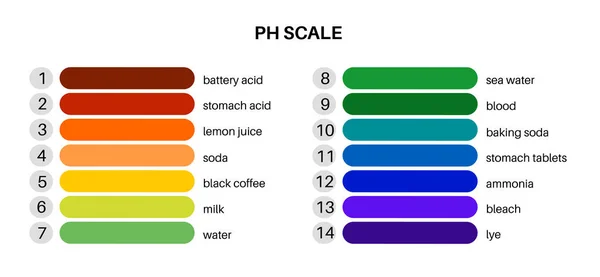
Stock vector pH scale diagram, measure how acidic or alkaline an aqueous solution is. The range from 0 to 14, with 7 being neutral. pHs of less than 7 are acidity, greater than 7 are base. Colorful chart vector.
Published:
Jun.03, 2022 11:46:19
Author:
Pikovit
Views:
7
Downloads:
0
File type:
vector
/
eps
File size:
0.44 MB
Orginal size:
8115
x
3754
px
Available sizes:
S
(500 x 231)
M
(1000 x 463)
L
(2000 x 925)
XL
(8115 x 3754)
VECT
(8115 x 3754)
EL0
(8115 x 3754)
Level:
bronze
Download Vector
Vector topics:
Table
Color
Red
Vector
Illustration
Paper
Liquid
Water
Diet
Rainbow
Symbol
Acid
Measure
Measurement
Test
Balance
Scale
Chemical
Experiment
Laboratory
Science
Strip
Neutral
Soil
System
Fluid
Base
Chemistry
Level
Meter
Control
Spectrum
Analysis
Graph
Value
Chart
Scientific
Result
Basic
Indicator
Diagram
Universal
Alkaline
Acidic
Ion
Acidity
Litmus
Ph
Alkali
Infographic
Similar stock vectors
PH Scale Isolated On White Background. Vector Illustration
3167 × 1900
PH Value Scale Chart.
7917 × 3334
Creative Vector Illustration Of PH Scale Value Isolated On Background. Chemical Art Design Infographic. Abstract Concept Graphic Litmus Paper Element.
9001 × 4800
Ph Scale With Product Names With Different Acidity. The Scale Is Arranged In The Form Of An Arrow From The Alkaline Product To The Acid
5565 × 7749
PH Scale Diagram, Measure How Acidic Or Alkaline An Aqueous Solution Is. The Range From 0 To 14, With 7 Being Neutral. PHs Of Less Than 7 Are Acidity, Greater Than 7 Are Base. Colorful Chart Vector.
5924 × 2997
The PH Scale Diagram On White Background Illustration
5384 × 5068
PH Value Scale Chart.
7917 × 2292
PH Value Scale Meter. PH Analysis Chemical Scale Value Test. Vector Stock Illustration.
8501 × 4723