photo free
Home Images Vectors Videos

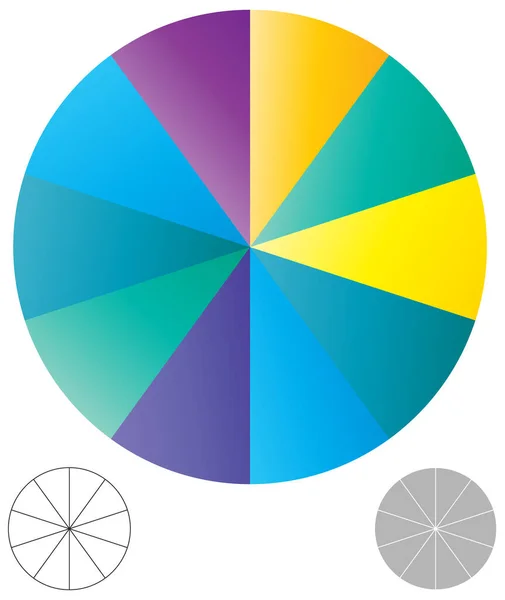
Stock vector Pie chart group vector graphic with modern soft bold gradient colors, nice spacing between slices, perfect for business presentations, isolated for easy editing

Stock vector Pie chart group vector graphic with modern soft bold gradient colors, nice spacing between slices, perfect for business presentations, isolated for easy editing
Published: Mar.20, 2019 09:38:33
Author: hobrath
Views: 15
Downloads: 0
File type: vector / eps
File size: 5.11 MB
Orginal size: 5000 x 5000 px
Available sizes:
S
(500 x 500)
M
(1000 x 1000)
L
(2000 x 2000)
XL
(5000 x 5000)
VECT
(5000 x 5000)
EL0
(5000 x 5000)
Level: bronze
Download Vector
Vector topics:

Similar stock vectors

stock vector Radial circular elements

Radial Circular Elements

5000 × 5805
stock image Infographic Template for 7 positions. Colorful area chart. White

Infographic Template For 7 Positions. Colorful Area Chart. White

5000 × 5000
stock vector color wheel with twelve colors

Color Wheel With Twelve Colors

5079 × 5079
stock vector Color palette triangle in a circle. Graphic color background. Square design. Vector illustration. Stock image.

Color Palette Triangle In A Circle. Graphic Color Background. Square Design. Vector Illustration. Stock Image.

5138 × 5138
stock image Arrows from colourful lines Around circle 10

Arrows From Colourful Lines Around Circle 10

6000 × 6000
stock vector Chromatic Circle

Chromatic Circle

3300 × 3300
stock vector simple pie chart-graph and diagram vector illustration. circle segmented, divided from 2 to 20 section, segment, portion or sector for biz analytics, presentation,infographics or visualization themes

Simple Pie Chart-graph And Diagram Vector Illustration. Circle Segmented, Divided From 2 To 20 Section, Segment, Portion Or Sector For Biz Analytics, Presentation,infographics Or Visualization Themes

5000 × 5932
stock vector simple pie chart-graph and diagram vector illustration. circle segmented, divided from 2 to 20 section, segment, portion or sector for biz analytics, presentation,infographics or visualization themes

Simple Pie Chart-graph And Diagram Vector Illustration. Circle Segmented, Divided From 2 To 20 Section, Segment, Portion Or Sector For Biz Analytics, Presentation,infographics Or Visualization Themes

5000 × 4903