
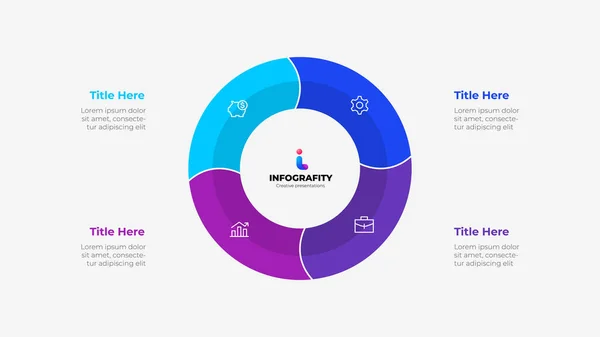
Stock vector Round diagram divided into 5 segments. Concept of five options of business project infographic.

Published: Mar.28, 2023 09:02:52
Author: abert84
Views: 1
Downloads: 0
File type: vector / eps
File size: 0.46 MB
Orginal size: 6000 x 3375 px
Available sizes:
Level: bronze
Similar stock vectors

Round Diagram Divided Into 6 Segments. Concept Of Six Options Of Business Project Infographic.
6000 × 3375
Round Diagram Divided Into 4 Segments. Concept Of Four Options Of Business Project Infographic.
6000 × 3375

Round Diagram Divided Into 3 Segments. Concept Of Three Options Of Business Project Infographic.
6000 × 3375
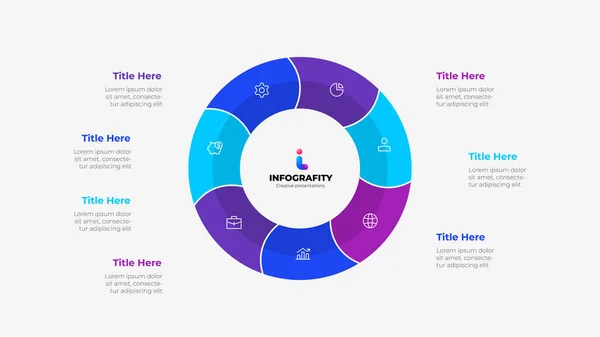
Round Diagram Divided Into 7 Segments. Concept Of Seven Options Of Business Project Infographic.
6000 × 3375

Cycle Diagram With 8 Options Or Steps. Infographic Template. Eight White Circles With Thin Lines.
6000 × 3375


