photo free
Home Images Vectors Videos

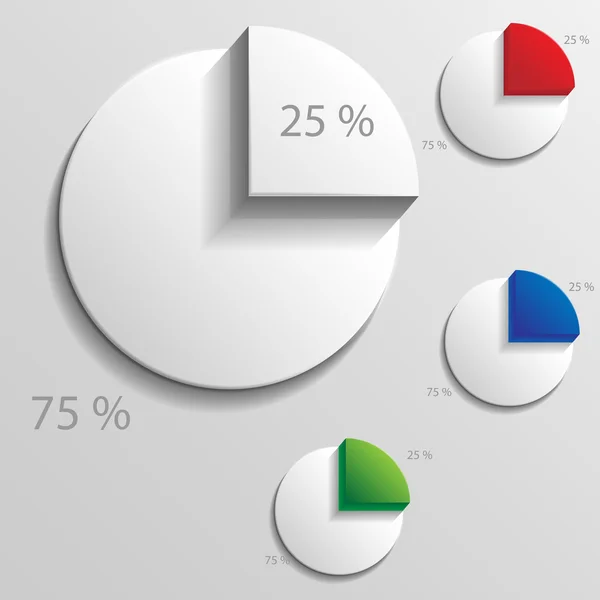
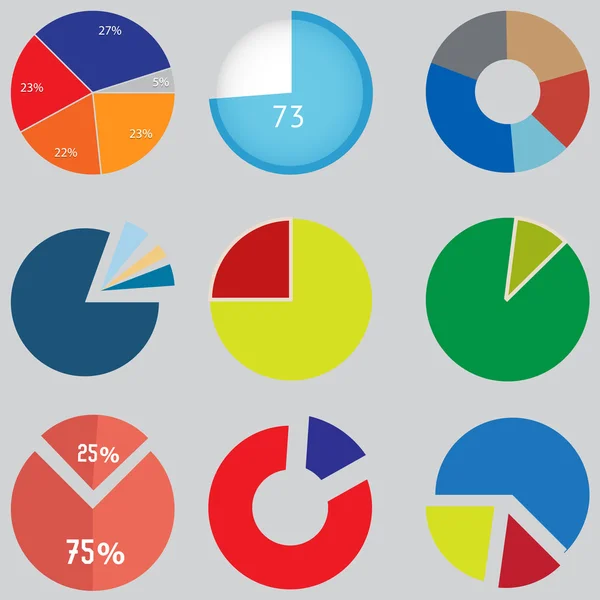
Stock vector set of 3D pie charts. business items and stats with the numbers.

Stock vector set of 3D pie charts. business items and stats with the numbers.
Published: Sep.04, 2015 09:47:09
Author: andrey-l
Views: 29
Downloads: 1
File type: vector / eps
File size: 19.26 MB
Orginal size: 5000 x 5000 px
Available sizes:
S
(500 x 500)
M
(1000 x 1000)
L
(2000 x 2000)
XL
(5000 x 5000)
VECT
(5000 x 5000)
EL0
(5000 x 5000)
Level: beginner
Download Vector
Vector topics:

Similar stock vectors

stock vector Infographic Elements, pie chart set icon, business elements and statistics

Infographic Elements, Pie Chart Set Icon, Business Elements And Statistics

5000 × 5000
stock vector Infographic 25 percent

Infographic 25 Percent

4573 × 4573
stock vector Infographic Elements, pie chart set icon, business elements and statistics

Infographic Elements, Pie Chart Set Icon, Business Elements And Statistics

5000 × 5000
stock vector Web

Web

4000 × 4000
stock vector Business infographics. Pie chart, graph with options, steps. Vector circular diagram.

Business Infographics. Pie Chart, Graph With Options, Steps. Vector Circular Diagram.

5000 × 3000
stock vector Isometric cycle diagram for infographics. Vector chart can be used for graph, report, presentation, brochure, web design. 3d pie.

Isometric Cycle Diagram For Infographics. Vector Chart Can Be Used For Graph, Report, Presentation, Brochure, Web Design. 3d Pie.

5976 × 4183
stock vector Vector 3d donut  chart infographic. Business progress infographics concept with 5 options, parts, steps, processes. Layered performance graph presentation. Circle diagram.

Vector 3d Donut Chart Infographic. Business Progress Infographics Concept With 5 Options, Parts, Steps, Processes. Layered Performance Graph Presentation. Circle Diagram.

5976 × 4183