photo free
Home Images Vectors Videos

Stock vector Set of circle diagrams for infographics
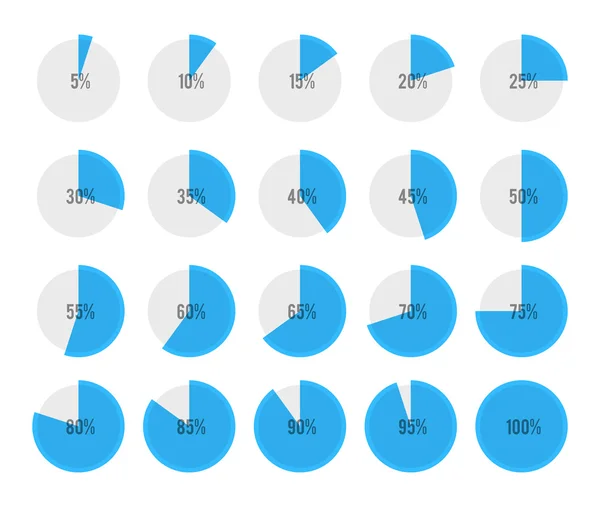
Stock vector Set of circle diagrams for infographics
Published: Feb.24, 2015 10:46:42
Author: Greeek
Views: 200
Downloads: 18
File type: vector / eps
File size: 0.53 MB
Orginal size: 5200 x 4400 px
Available sizes:
S
(500 x 423)
M
(1000 x 846)
L
(2000 x 1692)
XL
(5200 x 4400)
VECT
(5200 x 4400)
EL0
(5200 x 4400)
Level: bronze
Download Vector
Vector topics:

Similar stock vectors

stock vector Circle Diagram Pie Charts Infographic Elements. Progress Wheel Vector

Circle Diagram Pie Charts Infographic Elements. Progress Wheel Vector

5512 × 5512
stock vector Vector illustration of round progress bar. Circle indicators status. Loading and buffering percentage icon set. Circular interval timer. Art design. Abstract concept graphic element. Accuracy dial.

Vector Illustration Of Round Progress Bar. Circle Indicators Status. Loading And Buffering Percentage Icon Set. Circular Interval Timer. Art Design. Abstract Concept Graphic Element. Accuracy Dial.

6875 × 5000
stock vector Circle pie chart. Infographic percent circular diagram. Vector illustration 0 to 100 ready-to-use.

Circle Pie Chart. Infographic Percent Circular Diagram. Vector Illustration 0 To 100 Ready-to-use.

5528 × 4523
stock vector Business statistics vector. Diagram set.

Business Statistics Vector. Diagram Set.

2400 × 2400
stock vector Round orange loading bars with percentage numbers divided on segments from 1 to 20. Progress, waiting or downloading symbols set

Round Orange Loading Bars With Percentage Numbers Divided On Segments From 1 To 20. Progress, Waiting Or Downloading Symbols Set

5500 × 4000
stock vector Green progress indicators set, vector illustration for design

Green Progress Indicators Set, Vector Illustration For Design

4168 × 4168
stock vector Set of colorful circle percentage diagrams for infographics, 0 5 10 15 20 25 30 35 40 45 50 55 60 65 70 75 80 85 90 95 100 percent. Vector illustration

Set Of Colorful Circle Percentage Diagrams For Infographics, 0 5 10 15 20 25 30 35 40 45 50 55 60 65 70 75 80 85 90 95 100 Percent. Vector Illustration

6251 × 3234
stock vector Chart pie with 0 5 10 15 20 25 30 35 40 45 50 55 60 65 70 75 80 85 90 95 100 percent. Percentage circle graph.

Chart Pie With 0 5 10 15 20 25 30 35 40 45 50 55 60 65 70 75 80 85 90 95 100 Percent. Percentage Circle Graph.

6860 × 3644