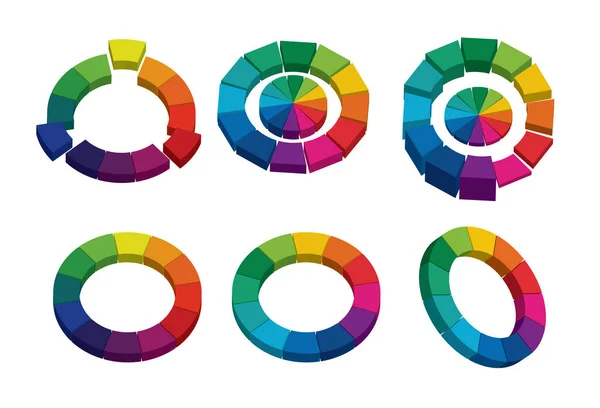
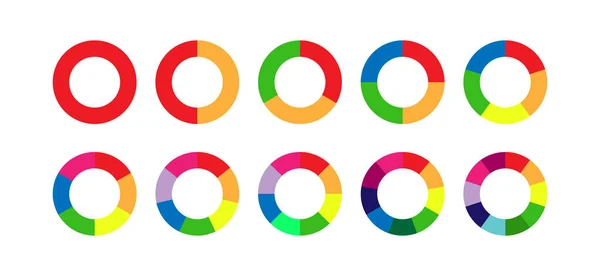
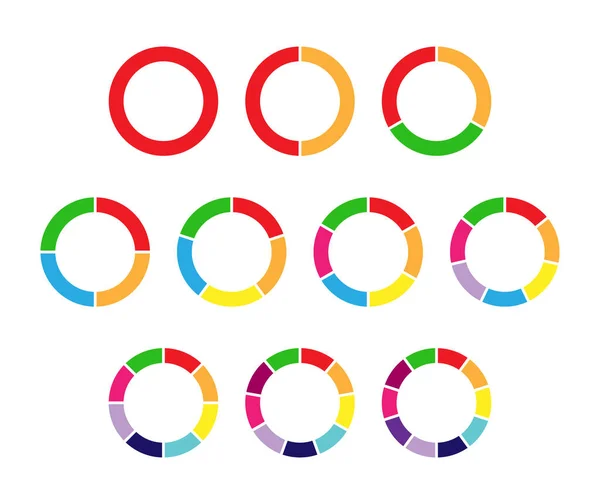
Stock vector set of colored pie charts for 1,2,3,4,5,6,7,8,9,10 steps or sections to illustrate a business plan, infographic, reporting. Simple design, stock vector illustration.
Published: Mar.31, 2020 10:00:47
Author: Grommik
Views: 12
Downloads: 4
File type: vector / eps
File size: 5.26 MB
Orginal size: 4755 x 4000 px
Available sizes:
Level: bronze