photo free
Home Images Vectors Videos

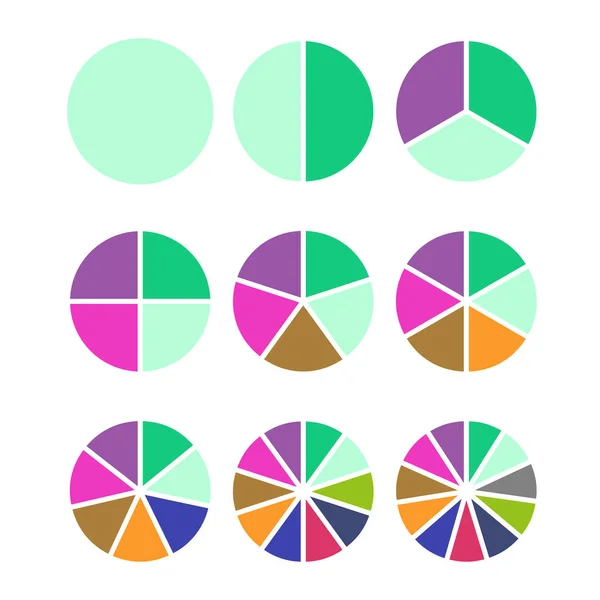
Stock vector Set of colored pie charts. Templates sectoral graphs in flat style. Colorful elements for infographics. Vector

Stock vector Set of colored pie charts. Templates sectoral graphs in flat style. Colorful elements for infographics. Vector
Published: Nov.24, 2016 10:12:41
Author: Domira
Views: 59
Downloads: 7
File type: vector / eps
File size: 1.07 MB
Orginal size: 6000 x 6000 px
Available sizes:
S
(500 x 500)
M
(1000 x 1000)
L
(2000 x 2000)
XL
(6000 x 6000)
VECT
(6000 x 6000)
EL0
(6000 x 6000)
Level: beginner
Download Vector
Vector topics:

Similar stock vectors

stock vector Set of colored pie charts with rounded forms. Templates sectoral charts. Colorful elements for infographics. Vector

Set Of Colored Pie Charts With Rounded Forms. Templates Sectoral Charts. Colorful Elements For Infographics. Vector

6000 × 6000
stock vector Set of colored pie charts. Templates sectoral graphs in flat style. Colorful elements for infographics. Vector

Set Of Colored Pie Charts. Templates Sectoral Graphs In Flat Style. Colorful Elements For Infographics. Vector

6000 × 6000
stock vector Pie charts set, part segment, infographic template for business report. Vector illustration. Pie element presentation, business diagram set, circular data, step cycle plan, abstract graphic part

Pie Charts Set, Part Segment, Infographic Template For Business Report. Vector Illustration. Pie Element Presentation, Business Diagram Set, Circular Data, Step Cycle Plan, Abstract Graphic Part

5315 × 5315
stock vector Set of colored pie charts. Templates sectoral graphs in flat style. Business data, colorful elements for infographics. Vector

Set Of Colored Pie Charts. Templates Sectoral Graphs In Flat Style. Business Data, Colorful Elements For Infographics. Vector

6000 × 6000
stock vector set of colored pie charts for 1,2,3,4,5,6,7,8,9,10 steps or sections to illustrate a business plan, infographic, reporting. Simple design, stock vector illustration.

Set Of Colored Pie Charts For 1,2,3,4,5,6,7,8,9,10 Steps Or Sections To Illustrate A Business Plan, Infographic, Reporting. Simple Design, Stock Vector Illustration.

4755 × 4000
stock vector Set of colored pie charts. Templates sectoral graphs in flat style. Colorful elements for infographics. Vector

Set Of Colored Pie Charts. Templates Sectoral Graphs In Flat Style. Colorful Elements For Infographics. Vector

9722 × 9722
stock vector Pie chart. Circle graph with section from 1 to 11. 6, 5, 3 infographic part in round diagram. Graphic icon of wheel for cycle process. Piece of pie chart for progress, statistics and analysis. Vector.

Pie Chart. Circle Graph With Section From 1 To 11. 6, 5, 3 Infographic Part In Round Diagram. Graphic Icon Of Wheel For Cycle Process. Piece Of Pie Chart For Progress, Statistics And Analysis. Vector.

4895 × 4000
stock vector Set of colored pie charts. Templates sectoral graphs in flat style. Colorful elements for infographics. Vector

Set Of Colored Pie Charts. Templates Sectoral Graphs In Flat Style. Colorful Elements For Infographics. Vector

6000 × 6000