Home
Images
Vectors
Videos
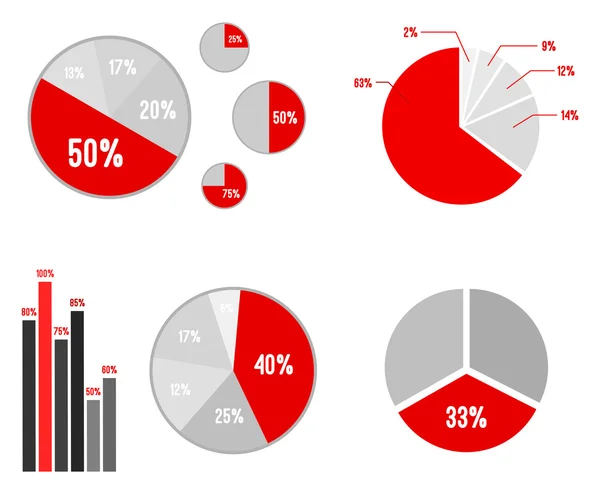
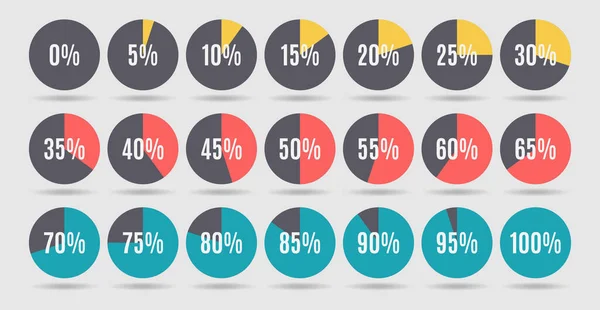
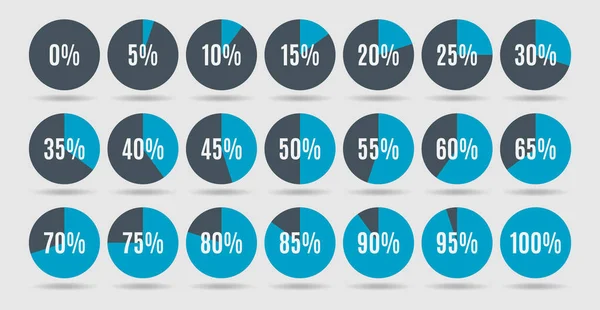
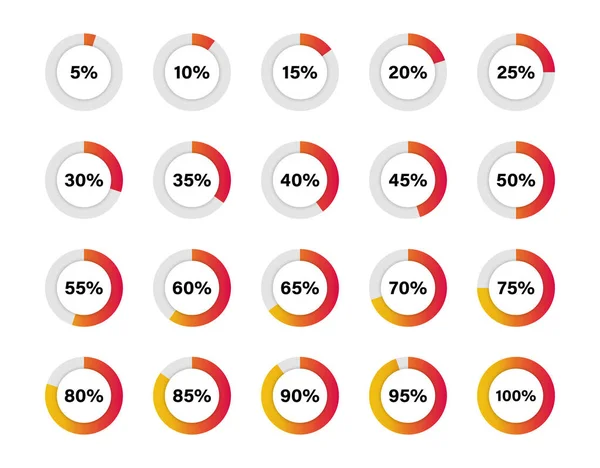
Stock vector Set of trendy circle infographic pie chart diagrams design elements with percentages.
Published:
Apr.05, 2022 07:23:44
Author:
Bisams
Views:
11
Downloads:
2
File type:
vector
/
eps
File size:
5.3 MB
Orginal size:
6000
x
3543
px
Available sizes:
S
(500 x 295)
M
(1000 x 591)
L
(2000 x 1181)
XL
(6000 x 3543)
VECT
(6000 x 3543)
EL0
(6000 x 3543)
Level:
beginner
Download Vector
Vector topics:
Vector
Round
Circle
Graphic
Element
Illustration
Design
Set
Isolated
Business
Financial
Percentage
Sign
Pie
Modern
Symbol
Concept
Icon
Percent
Flat
Data
Information
Presentation
Ring
Finance
Template
Strategy
Collection
Dashboard
Report
Loading
Analysis
Graph
Management
Chart
Process
Circular
Progress
Statistics
Loader
Indicator
Info
Diagram
Statistic
Ui
Infographic
User Interface
Infograph
Similar stock vectors
Set Of Editable Trendy Line Style Round Infographic Pie Chart Design Elements With Percentages.
6000 × 3543
Set Of Trendy Circle Infographic Pie Chart Diagrams Design Elements With Percentages.
6000 × 3543
Pie Charts And Bar Graphic Statistics
8500 × 7002
Set Of Colorful Circle Percentage Diagrams For Infographics, 0 5 10 15 20 25 30 35 40 45 50 55 60 65 70 75 80 85 90 95 100 Percent. Vector Illustration
6251 × 3234
Set Of Colorful Circle Percentage Diagrams For Infographics, 0 5 10 15 20 25 30 35 40 45 50 55 60 65 70 75 80 85 90 95 100 Percent. Vector Illustration
7250 × 3750
Set Of Trendy Circle Infographic Pie Chart Diagrams Design Elements With Percentages.
6000 × 3543
Set Of Trendy Circle Infographic Pie Chart Diagrams Design Elements With Percentages.
6000 × 3543
Set Of Red, Orange Circle Percentage Diagram. Progress Or Loading Circle Symbols. From 0 To 100. Gradient Circle. Vector
4500 × 3516