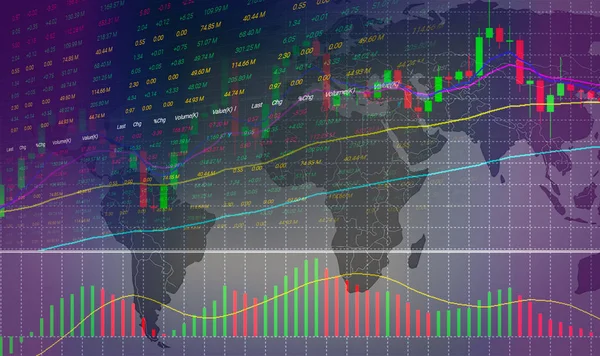
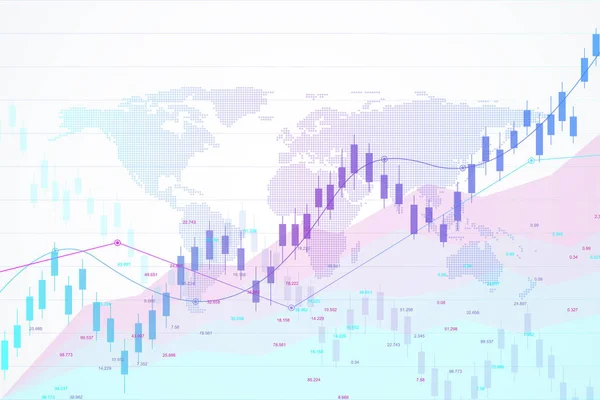
Stock vector Stock market or forex trading graph chart suitable for financial investment concept. Economy trends background for business idea. Abstract finance background. Vector illustration.

Published: Nov.20, 2018 08:24:08
Author: berya113
Views: 31
Downloads: 3
File type: vector / eps
File size: 6.73 MB
Orginal size: 5905 x 3937 px
Available sizes:
Level: bronze