Home
Images
Vectors
Videos
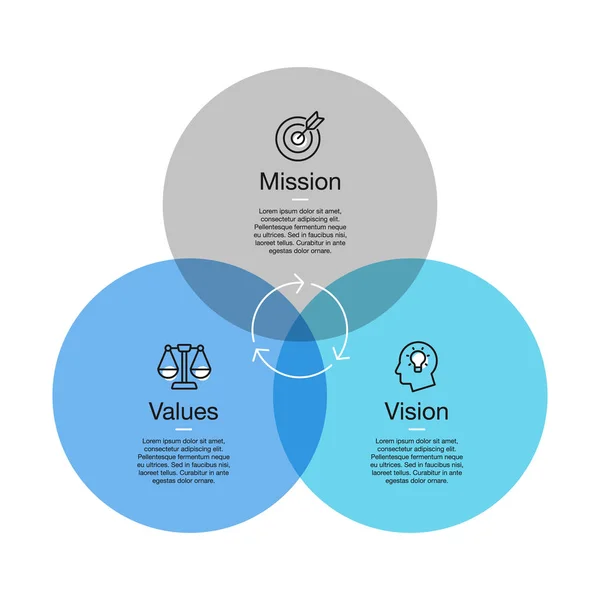
Stock vector The Venn diagram of the 3P formula methodology starts from passion vision, mission, and value. The second is profits in customer and revenue data analysis and purposes for innovation implementation.
Published:
Jun.19, 2022 08:47:59
Author:
joebite
Views:
2
Downloads:
0
File type:
vector
/
eps
File size:
29.38 MB
Orginal size:
4000
x
4001
px
Available sizes:
S
(500 x 500)
M
(1000 x 1000)
L
(2000 x 2000)
XL
(4000 x 4001)
VECT
(4000 x 4001)
EL0
(4000 x 4001)
Level:
beginner
Download Vector
Vector topics:
Vector
Circle
Illustration
Business
Customer
People
Risk
Formula
Concept
Digital
Data
Development
Presentation
Template
Strategy
Company
System
Alternative
Vision
Team
Infrastructure
Innovation
Owner
Social
Graph
Value
Chart
Passion
Circular
Revenue
Profit
Communities
Diagram
Responsibility
Purpose
Equality
Implement
Competence
Goals
Implementation
Competency
Inequality
Viable
Methodology
Formulary
Infographic
Scalability
Venn Diagrams
System Mitigation
Similar stock vectors
The Venn Diagram Of The 3P Formula Methodology Starts From Passion Vision, Mission, And Value. The Second Is Profits In Customer And Revenue Data Analysis And Purposes For Innovation Implementation.
4000 × 4001
Simple Visualization For Mission, Vision And Values Diagram With Colorful Circles And Line Icons With Accent. Easy To Use For Your Design Or Presentation.
5000 × 5000
Mission Vision And Values Diagram With Colorful Circles
5000 × 5000
Vector
5000 × 3992
Thin Line Flat Social Media Sales Funnel Infographic.
7000 × 3938
Product Lifecycle Management Or PLM Is The Process Of Managing A Products Lifecycle From Inception, Through Design And Manufacturing, To Sales, Service, And Eventually Retirement
5000 × 4000
Timeline Infographics Template, Vector Infographics Timeline Design Template With 10 Label, Vector. Can Be Used For Workflow Layout, Diagram, Number Step Up Options.
7170 × 4643