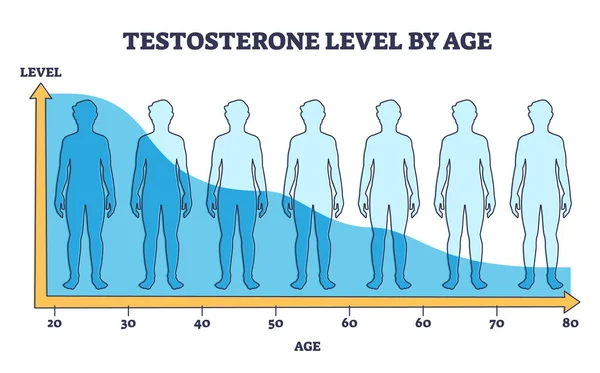
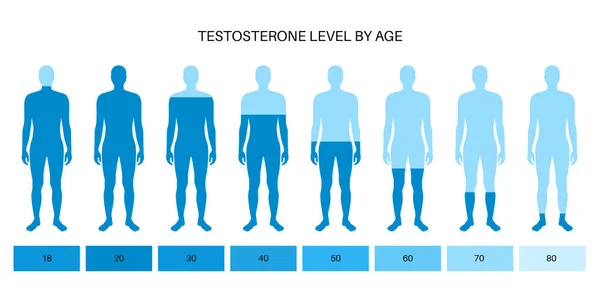
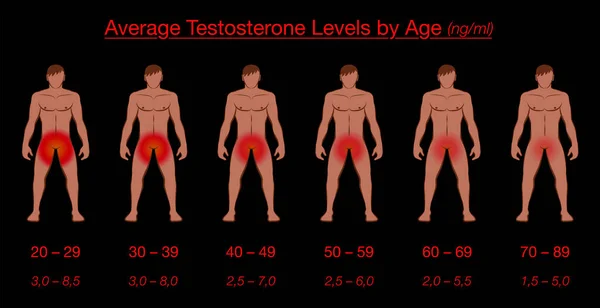
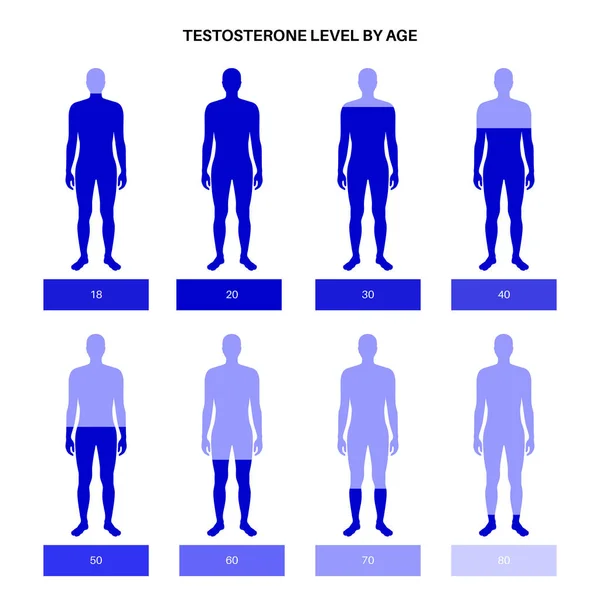
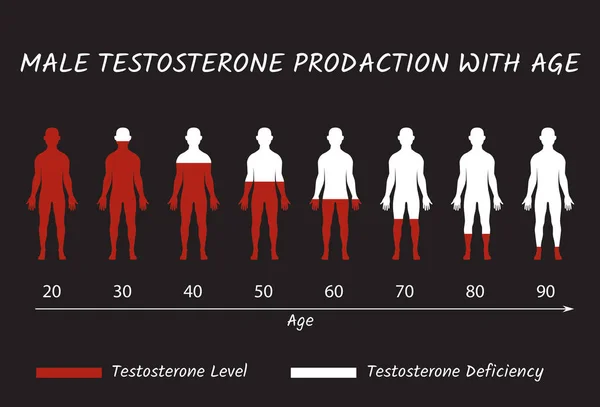
Stock vector variation in serum testosterone levels across different ages, highlighting hormonal changes in men diagram hand drawn schematic vector illustration. Medical science educational illustration

Published: Jun.24, 2024 18:10:04
Author: AlexanderPokusay
Views: 3
Downloads: 0
File type: vector / eps
File size: 0.76 MB
Orginal size: 6087 x 3457 px
Available sizes:
Level: silver