Home
Images
Vectors
Videos
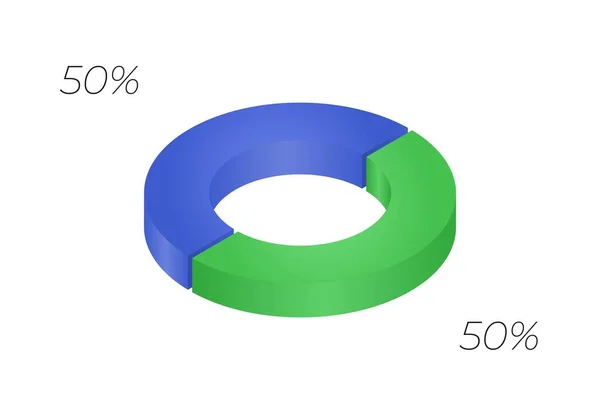
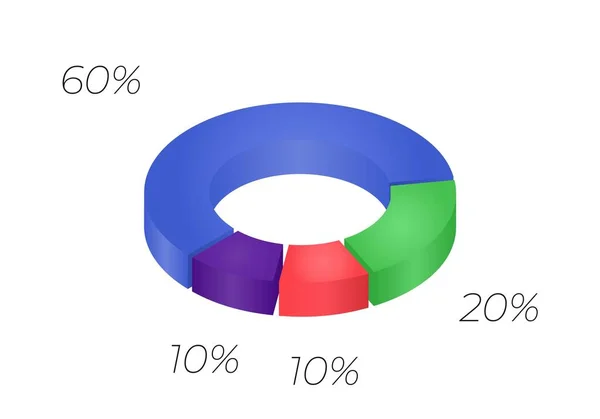
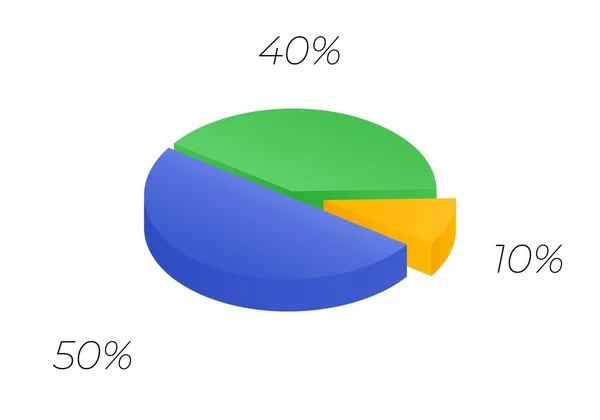
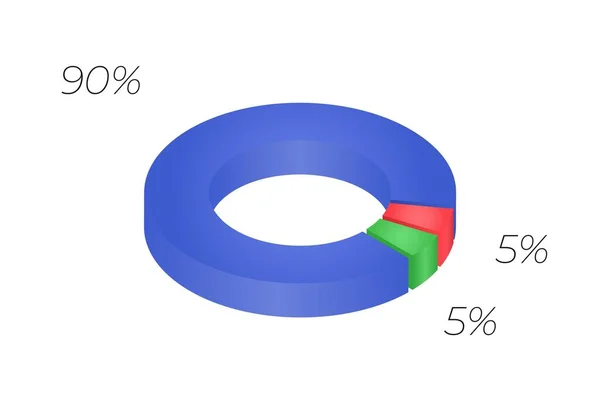
Stock vector Vector 3d donut chart infographic. Business progress infographics concept with 3 options, parts, steps, processes. Layered performance graph presentation. Circle diagram.
Published:
Jan.13, 2021 09:25:26
Author:
April_Ola
Views:
0
Downloads:
0
File type:
vector
/
eps
File size:
5.15 MB
Orginal size:
5976
x
4183
px
Available sizes:
S
(500 x 350)
M
(1000 x 700)
L
(2000 x 1400)
XL
(5976 x 4183)
VECT
(5976 x 4183)
EL0
(5976 x 4183)
Level:
beginner
Download Vector
Vector topics:
Vector
Background
Object
Circle
Graphic
Element
Illustration
Five
Isolated
Shape
Business
Success
Pie
Technology
3d
Three
Modern
Creative
Icon
Percent
Flat
Simple
Step
Presentation
Web
Finance
Template
Geometric
Wheel
Strategy
Marketing
Hub
Research
Graph
Chart
Process
Info
Diagram
Stair
Donut
Options
Isometric
Workflow
90
Timeline
Ninety
Infographic
Flow Chart
Similar stock vectors
Vector 3d Donut Chart Infographic. Business Progress Infographics Concept With 3 Options, Parts, Steps, Processes. Layered Performance Graph Presentation. Circle Diagram.
5976 × 4183
Vector 3d Donut Chart Infographic. Business Progress Infographics Concept With 2 Options, Parts, Steps, Processes. Layered Performance Graph Presentation. Circle Diagram.
5976 × 4183
Vector 3d Donut Chart Infographic. Business Progress Infographics Concept With 2 Options, Parts, Steps, Processes. Layered Performance Graph Presentation. Circle Diagram.
5976 × 4183
Vector 3d Donut Chart Infographic. Business Progress Infographics Concept With 2 Options, Parts, Steps, Processes. Layered Performance Graph Presentation. Circle Diagram.
5976 × 4183
Vector 3d Donut Chart Infographic. Business Progress Infographics Concept With 3 Options, Parts, Steps, Processes. Layered Performance Graph Presentation. Circle Diagram.
5976 × 4183
Vector 3d Donut Chart Infographic. Business Progress Infographics Concept With 2 Options, Parts, Steps, Processes. Layered Performance Graph Presentation. Circle Diagram.
5976 × 4183
Vector 3d Donut Chart Infographic. Business Progress Infographics Concept With 4 Options, Parts, Steps, Processes. Layered Performance Graph Presentation. Circle Diagram.
5976 × 4183
Isometric Cycle Diagram For Infographics In 3 Parts. Vector Chart Can Be Used For Graph, Report, Presentation, Brochure, Web Design. 3d Pie.
5976 × 4183