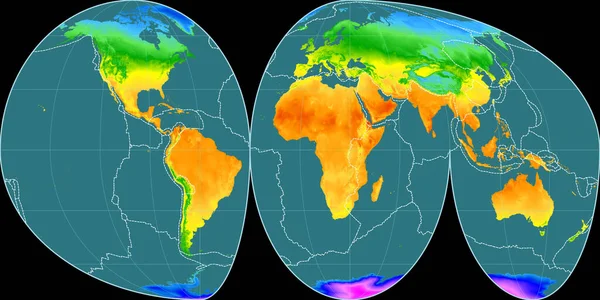
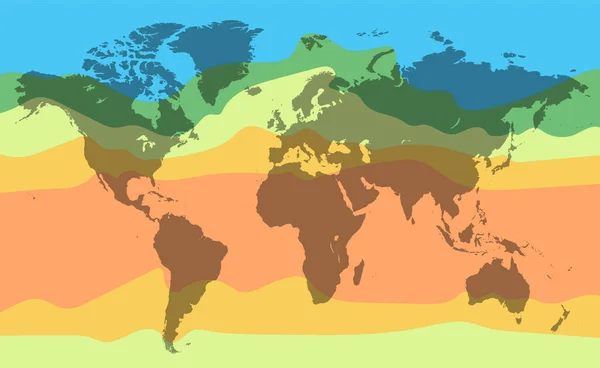
Stock vector World climate temperature map. Detailed vector illustration
Published: Nov.07, 2019 07:51:17
Author: mutlik1.yandex.ru
Views: 51
Downloads: 1
File type: vector / eps
File size: 7.21 MB
Orginal size: 5400 x 3318 px
Available sizes:
Level: beginner