
Stock image 40 Percent Progress
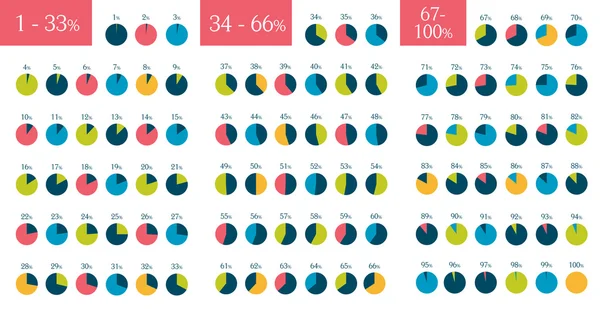
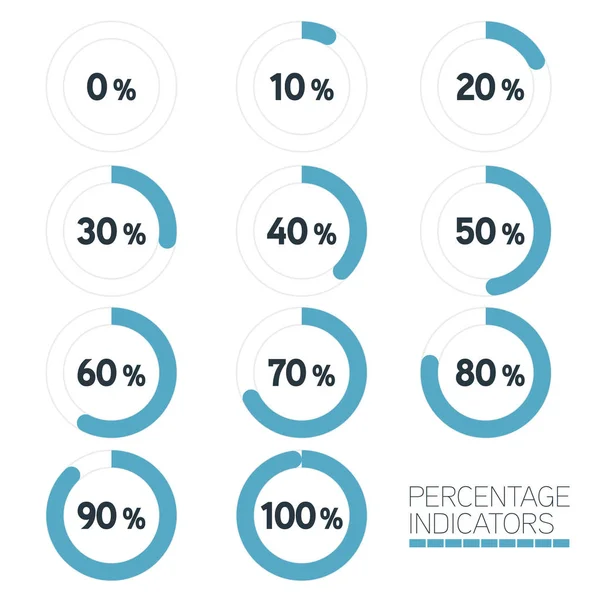
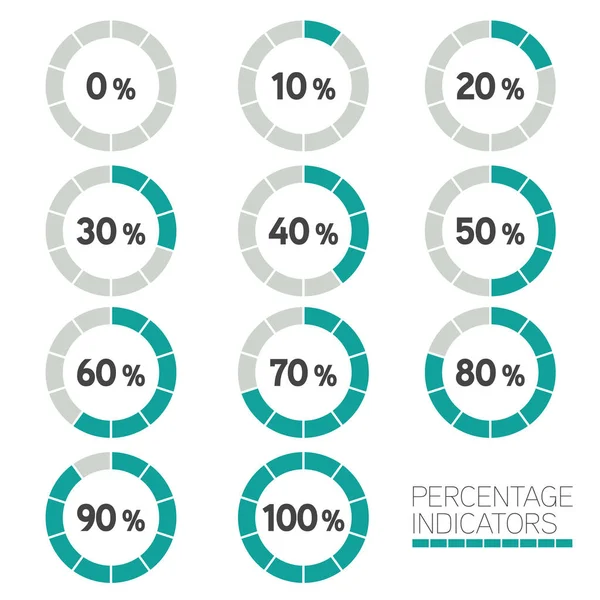
Mega Set Of Infographic Percentage Circle Pie Charts. 1 % To 100 %. Vector Isolated Elements.
Vector, 0.38MB, 7087 × 3652 ai

Colorful Pie Chart Representing Forty Percent, A Visual Representation Of Data For Business Presentations
Vector, 0.96MB, 5000 × 5000 eps


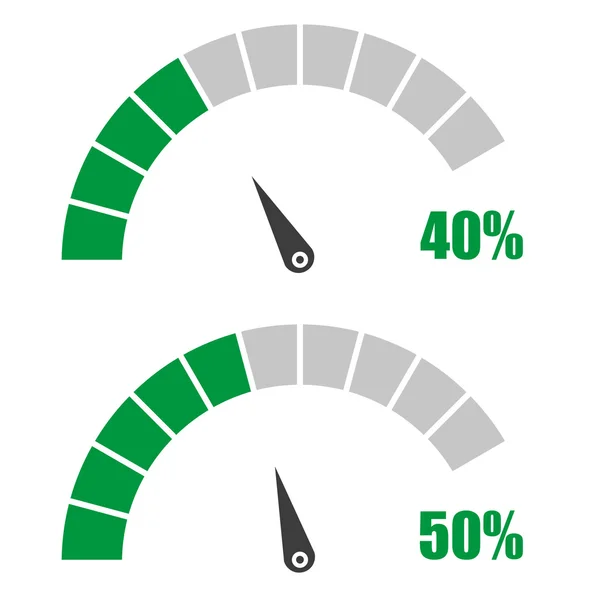
Set Of Speedometer Or Rating Meter Signs Infographic Gauge Element With Percent 40, 50
Vector, 0.76MB, 4167 × 4167 eps
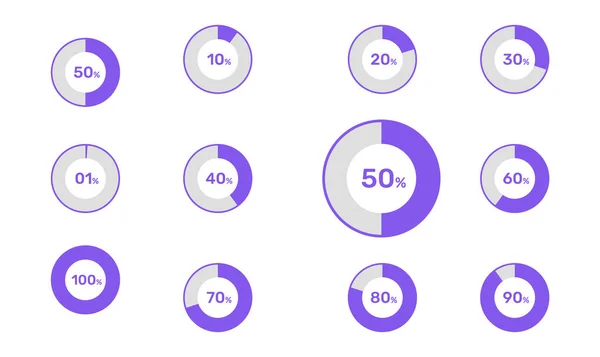
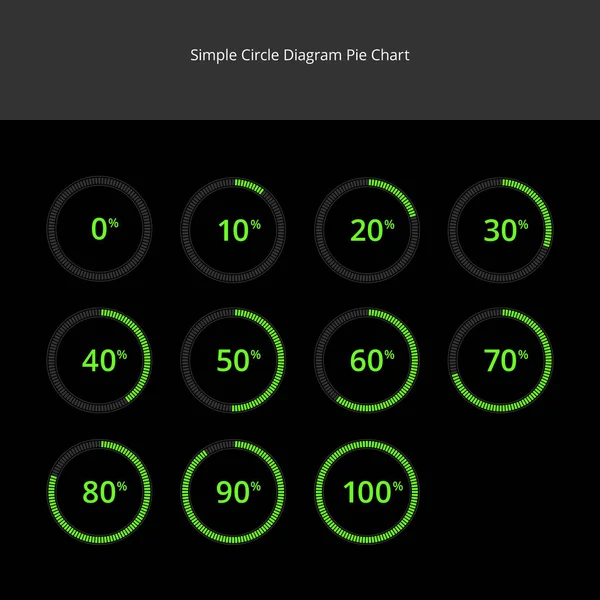
Circle Diagram Set With Percentage. Pie Chart Infographics Template. 01 10 20 30 40 50 60 70 80 90 100 Percent Ready To Use For Web Design, Infographic Or Business
Vector, 0.91MB, 6038 × 3600 eps
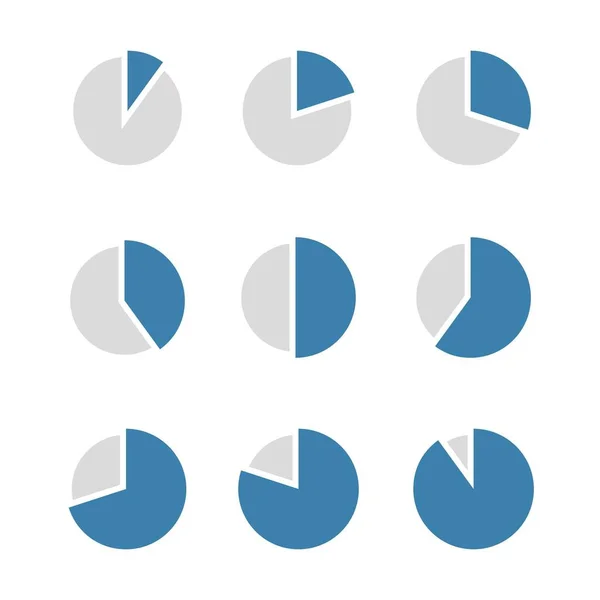
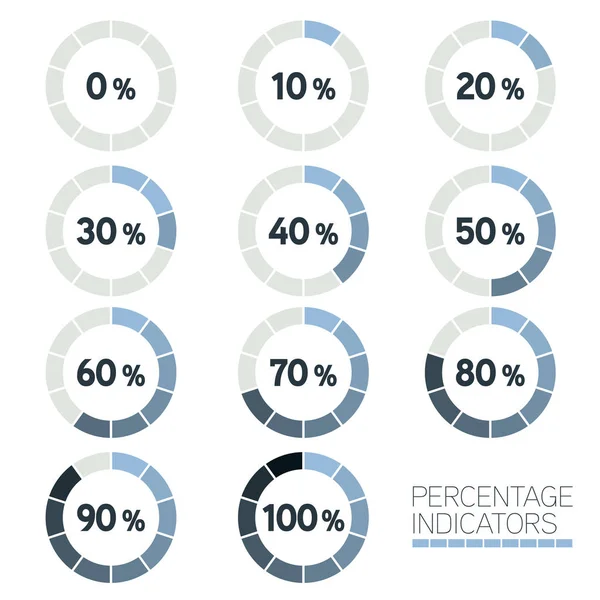
Set Of Pie Charts Percentage 10, 20, 30, 40, 50, 60, 70, 80, 90. Pie Graph Diagram, Circle Round Chart. Grey And Blue On White Background. Isolated Vector Infographics For Presentation.
Vector, 0.55MB, 4000 × 4000 eps

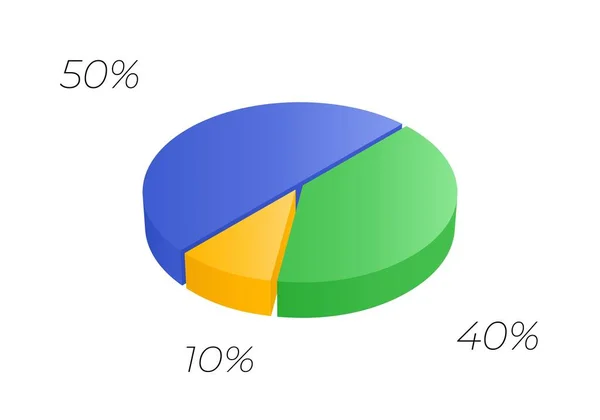
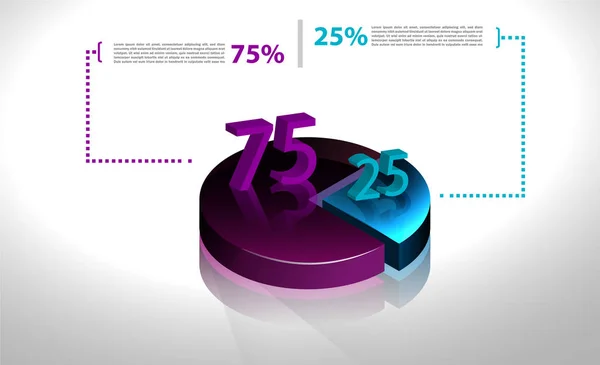
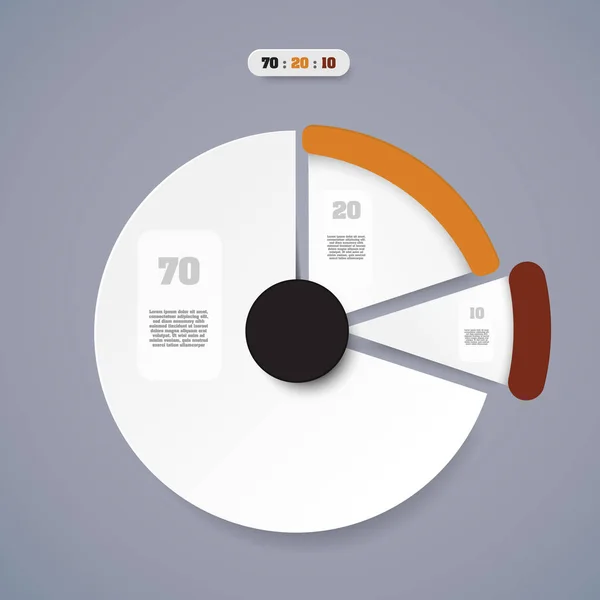
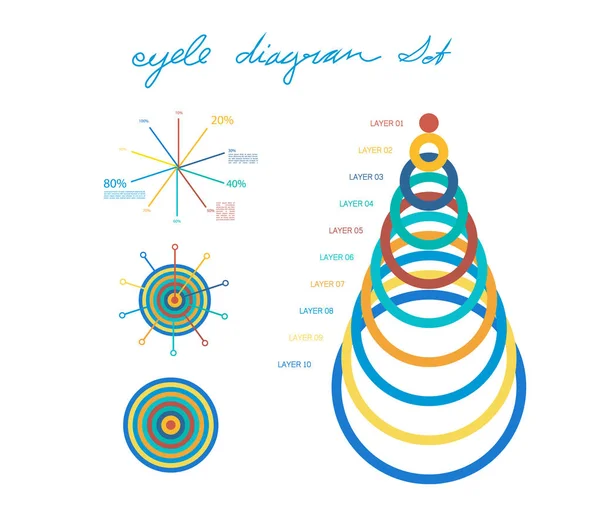
Isometric Cycle Diagram For Infographics In 3 Parts. Vector Chart Can Be Used For Graph, Report, Presentation, Brochure, Web Design. 3d Pie.
Vector, 5.13MB, 5976 × 4183 eps

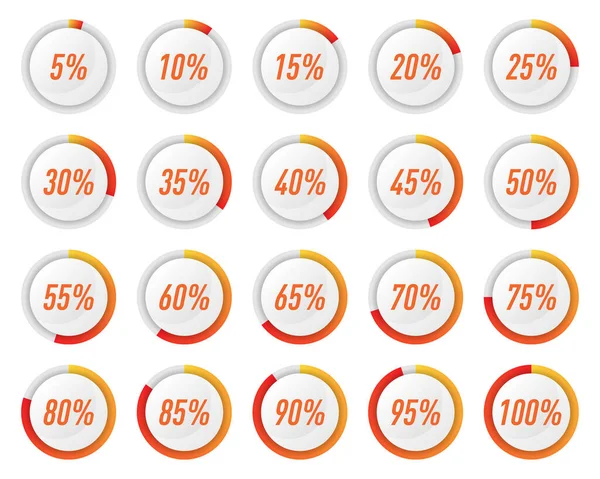
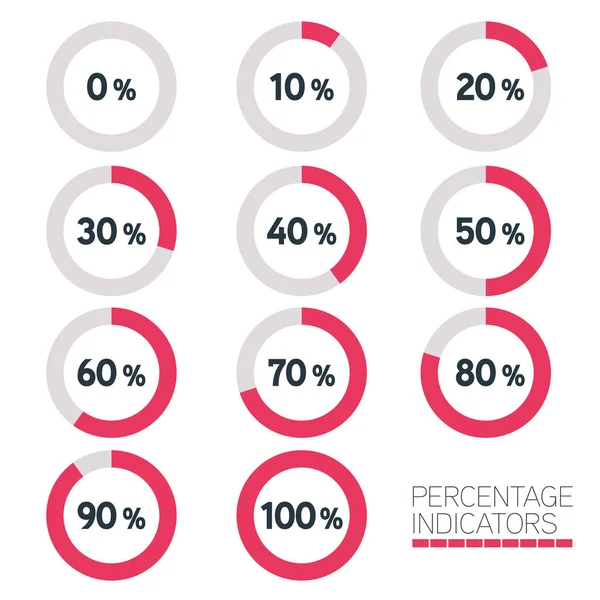
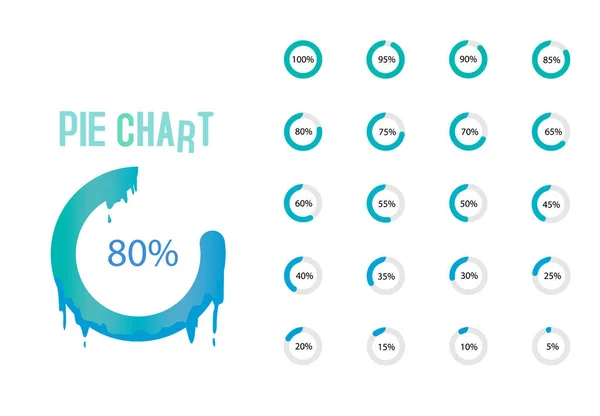
Pie Charts For Infographics.Set Of Circle Percentage Diagrams For Web Design, 0 5 10 15 20 25 30 35 40 45 50 55 60 65 70 75 80 85 90 95 100 Percent.Progress Bar For Business Infographics
Vector, 2.63MB, 4000 × 4000 eps
Isometric Cycle Diagram For Infographics. Vector Chart Can Be Used For Graph, Report, Presentation, Brochure, Web Design. 3d Pie.
Vector, 5.14MB, 5976 × 4183 eps

Isometric Cycle Diagram For Infographics In 4 Parts. Vector Chart Can Be Used For Graph, Report, Presentation, Brochure, Web Design. 3d Pie.
Vector, 5.14MB, 5976 × 4183 eps

Isometric Cycle Diagram For Infographics. Vector Chart Can Be Used For Graph, Report, Presentation, Brochure, Web Design. 3d Pie.
Vector, 5.12MB, 5976 × 4183 eps


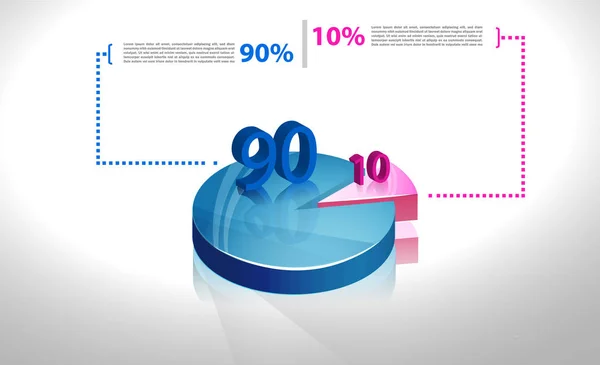
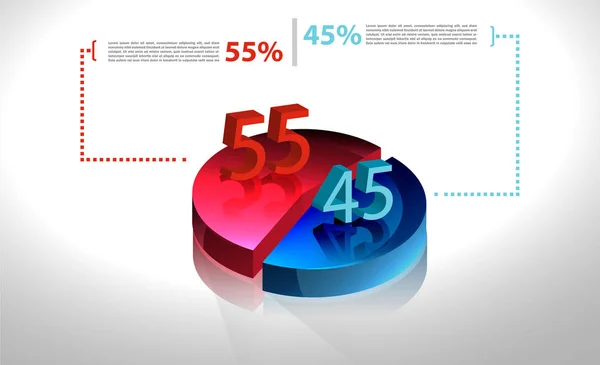
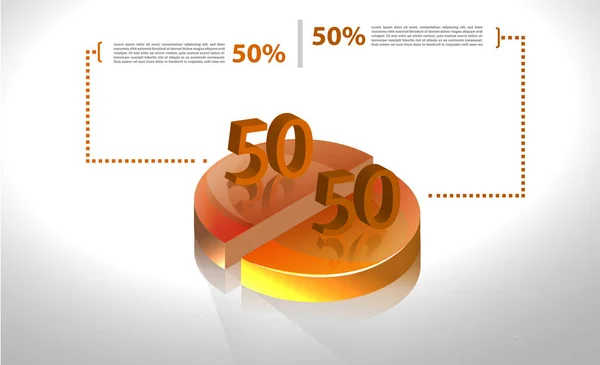
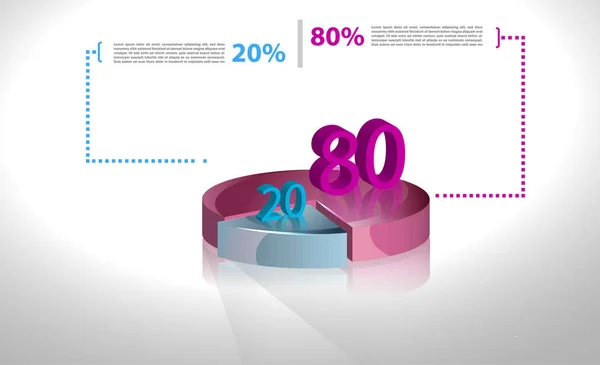
Isometric Cycle Diagram For Infographics In 2 Parts. Vector Chart Can Be Used For Graph, Report, Presentation, Brochure, Web Design. 3d Pie.
Vector, 5.12MB, 5976 × 4183 eps

Vector 3d Donut Chart Infographic. Business Progress Infographics Concept With 3 Options, Parts, Steps, Processes. Layered Performance Graph Presentation. Circle Diagram.
Vector, 5.15MB, 5976 × 4183 eps


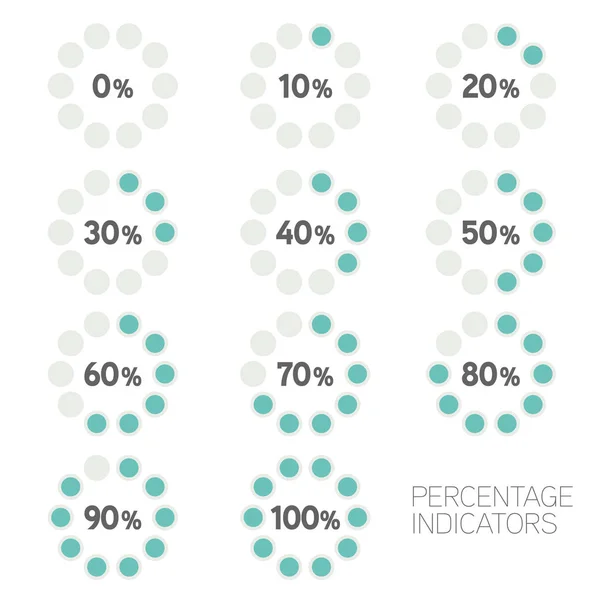
Icons Set For Web, Design, Download, Progress. Percentage Vector Symbols. 0 To 100 Percent.
Vector, 5.24MB, 8000 × 3346 eps


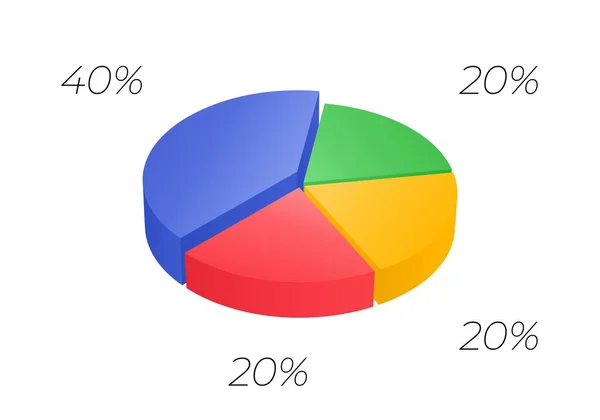
Isometric Cycle Diagram For Infographics In 5 Parts. Vector Chart Can Be Used For Graph, Report, Presentation, Brochure, Web Design. 3d Pie.
Vector, 5.15MB, 5976 × 4183 eps


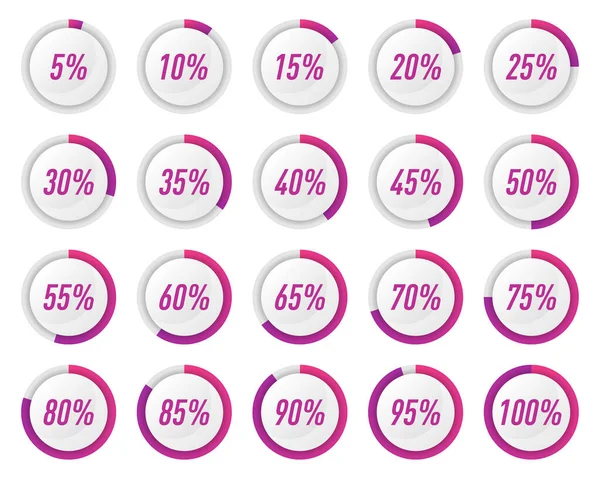
Pie Charts For Infographics.Set Of Circle Percentage Diagrams For Web Design, 0 5 10 15 20 25 30 35 40 45 50 55 60 65 70 75 80 85 90 95 100 Percent.Progress Bar For Business Infographics
Vector, 1.46MB, 4000 × 4000 eps

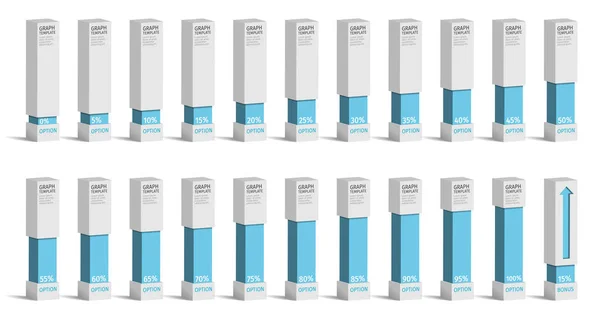
Set Of Blue Percentage Charts For Infographics, 0 5 10 15 20 25 30 35 40
Vector, 1.92MB, 7255 × 3865 eps
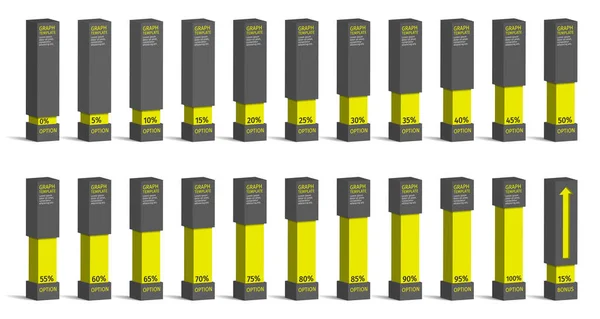
Set Of Percentage Charts Diagrams For Infographics, 0 5 10 15 20 25 30 35 40
Vector, 1.92MB, 7255 × 3865 eps
Page 1 >> Next