photo free
Home Images Vectors Videos

Stock image 95 Circle Infographic

stock vector 95 percents pie chart infographic elements. 95% percentage infographic circle icons for download, illustration, business, web design

95 Percents Pie Chart Infographic Elements. 95% Percentage Infographic Circle Icons For Download, Illustration, Business, Web Design

Vector, 0.52MB, 5148 × 4108 eps
stock vector 95% circle diagrams Infographics vector, 95 Percentage ready to use for web design

95% Circle Diagrams Infographics Vector, 95 Percentage Ready To Use For Web Design

Vector, 0.47MB, 5212 × 4000 eps
stock vector Set of business cycle flow diagrams, pie chart for documents,rep

Set Of Business Cycle Flow Diagrams, Pie Chart For Documents,rep

Vector, 1.78MB, 5000 × 5000 ai
stock vector Set of business cycle flow diagrams, pie chart for documents,rep

Set Of Business Cycle Flow Diagrams, Pie Chart For Documents,rep

Vector, 2.18MB, 2500 × 2500 ai
stock vector Set of business cycle flow diagrams, pie chart for documents,rep

Set Of Business Cycle Flow Diagrams, Pie Chart For Documents,rep

Vector, 1.03MB, 7860 × 4796 ai
stock vector Set of business cycle flow diagrams, pie chart for documents,rep

Set Of Business Cycle Flow Diagrams, Pie Chart For Documents,rep

Vector, 1.69MB, 7321 × 6057 ai
stock vector Set of business cycle flow diagrams, pie chart for documents,rep

Set Of Business Cycle Flow Diagrams, Pie Chart For Documents,rep

Vector, 2.48MB, 5000 × 5000 ai
stock vector Set of business cycle flow diagrams, pie chart for documents,rep

Set Of Business Cycle Flow Diagrams, Pie Chart For Documents,rep

Vector, 0.81MB, 7860 × 4796 ai
stock vector Set of business cycle flow diagrams, pie chart for documents,rep

Set Of Business Cycle Flow Diagrams, Pie Chart For Documents,rep

Vector, 0.77MB, 7860 × 4796 ai
stock vector Set of business cycle flow diagrams, pie chart for documents,rep

Set Of Business Cycle Flow Diagrams, Pie Chart For Documents,rep

Vector, 1.16MB, 8192 × 4996 ai
stock vector Set of business cycle flow diagrams, pie chart for documents,rep

Set Of Business Cycle Flow Diagrams, Pie Chart For Documents,rep

Vector, 1.09MB, 8075 × 4925 ai
stock vector Set of business cycle flow diagrams, pie chart for documents,rep

Set Of Business Cycle Flow Diagrams, Pie Chart For Documents,rep

Vector, 0.96MB, 8192 × 4999 ai
stock vector Set of circle percentage diagrams for infographics from 5 to 100. Gradient orange and red loading elements in modern clear style. Vector EPS10

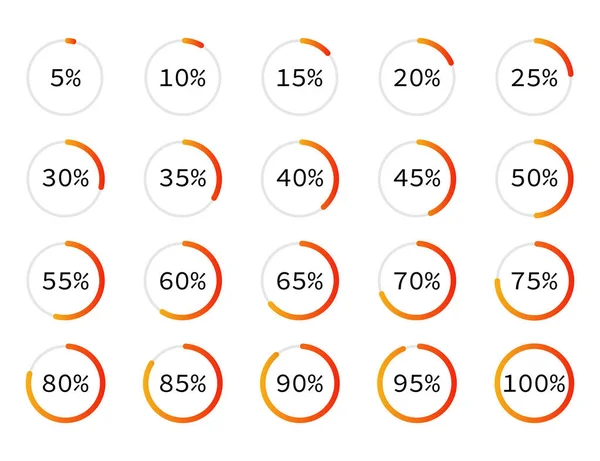
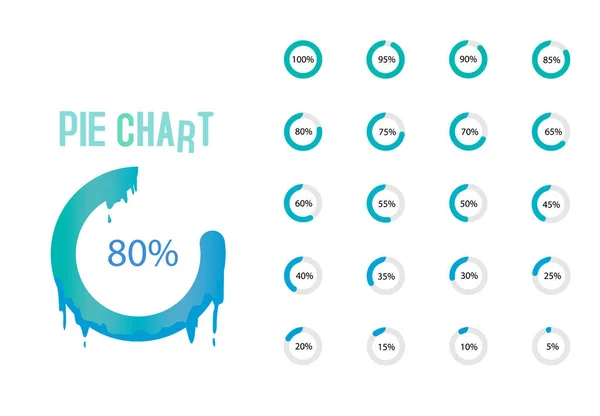
Set Of Circle Percentage Diagrams For Infographics From 5 To 100. Gradient Orange And Red Loading Elements In Modern Clear Style. Vector EPS10

Vector, 0.43MB, 5417 × 4167 eps
stock vector Pie charts for infographics.Set of circle percentage diagrams for web design, 0 5 10 15 20 25 30 35 40 45 50 55 60 65 70 75 80 85 90 95 100 percent.Progress bar for business infographics

Pie Charts For Infographics.Set Of Circle Percentage Diagrams For Web Design, 0 5 10 15 20 25 30 35 40 45 50 55 60 65 70 75 80 85 90 95 100 Percent.Progress Bar For Business Infographics

Vector, 2.63MB, 4000 × 4000 eps
stock vector Set of business cycle flow diagrams, pie chart for documents,rep

Set Of Business Cycle Flow Diagrams, Pie Chart For Documents,rep

Vector, 0.71MB, 6810 × 4725 ai
stock vector 95% circle percentage diagrams, 95 Percentage ready to use for web design, infographic or business

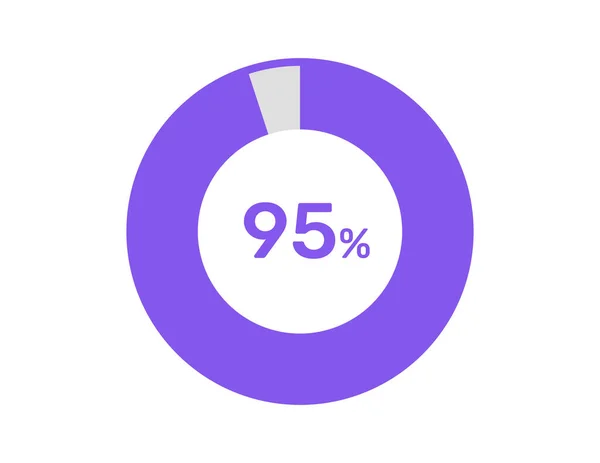
95% Circle Percentage Diagrams, 95 Percentage Ready To Use For Web Design, Infographic Or Business

Vector, 0.48MB, 4660 × 3600 eps
stock vector Set of business cycle flow diagrams, pie chart for documents,rep

Set Of Business Cycle Flow Diagrams, Pie Chart For Documents,rep

Vector, 0.85MB, 5172 × 4428 ai
stock vector Pie charts for infographics.Set of circle percentage diagrams for web design, 0 5 10 15 20 25 30 35 40 45 50 55 60 65 70 75 80 85 90 95 100 percent.Progress bar for business infographics

Pie Charts For Infographics.Set Of Circle Percentage Diagrams For Web Design, 0 5 10 15 20 25 30 35 40 45 50 55 60 65 70 75 80 85 90 95 100 Percent.Progress Bar For Business Infographics

Vector, 1.46MB, 4000 × 4000 eps
stock vector Set of green percentage charts for infographics, 0 5 10 15 20 25 30 35 40 45 50 55 60 65 70 75 80 85 90 95 100 percent. Vector illustration

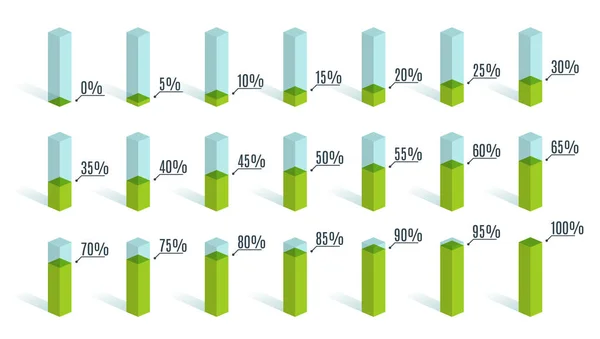
Set Of Green Percentage Charts For Infographics, 0 5 10 15 20 25 30 35 40 45 50 55 60 65 70 75 80 85 90 95 100 Percent. Vector Illustration

Vector, 0.87MB, 7500 × 4250 eps
stock vector Set of business cycle flow diagrams, pie chart for documents,rep

Set Of Business Cycle Flow Diagrams, Pie Chart For Documents,rep

Vector, 2.72MB, 6018 × 3753 ai
stock vector 95% percentage infographic circle icons, 95 percents pie chart infographic elements for Illustration, business, web design

95% Percentage Infographic Circle Icons, 95 Percents Pie Chart Infographic Elements For Illustration, Business, Web Design

Vector, 0.47MB, 5212 × 4000 eps
stock vector Set of blue percentage charts for infographics, 0 5 10 15 20 25 30 35 40

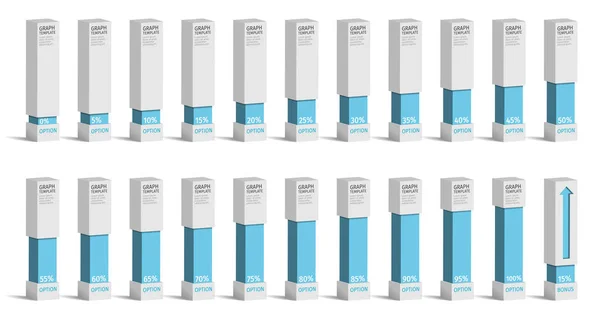
Set Of Blue Percentage Charts For Infographics, 0 5 10 15 20 25 30 35 40

Vector, 1.92MB, 7255 × 3865 eps
stock vector Set of percentage charts diagrams for infographics, 0 5 10 15 20 25 30 35 40

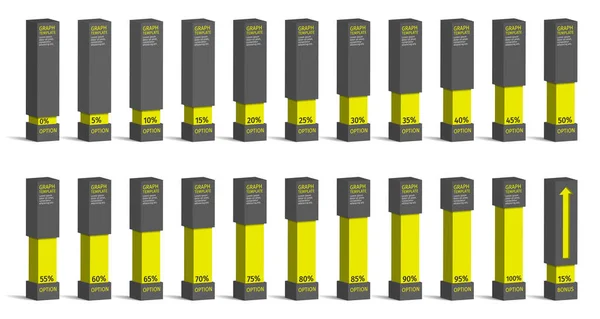
Set Of Percentage Charts Diagrams For Infographics, 0 5 10 15 20 25 30 35 40

Vector, 1.92MB, 7255 × 3865 eps
Page 1 >> Next