photo free
Home Images Vectors Videos

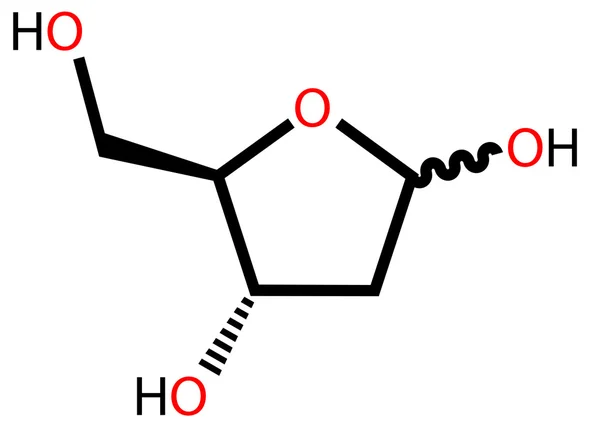
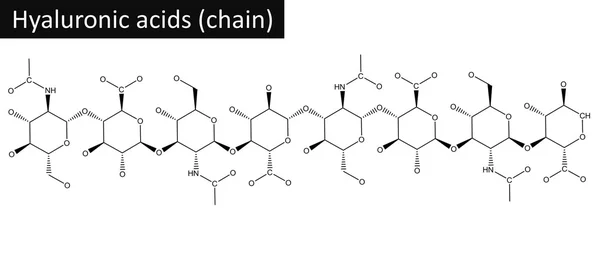
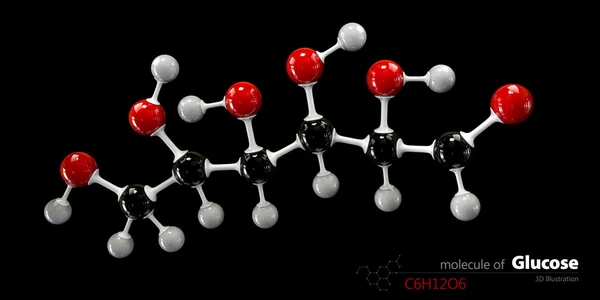
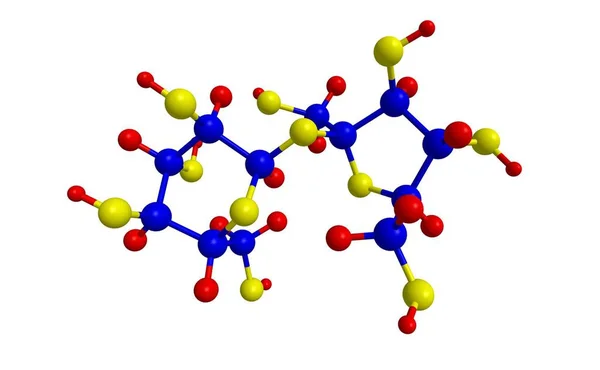
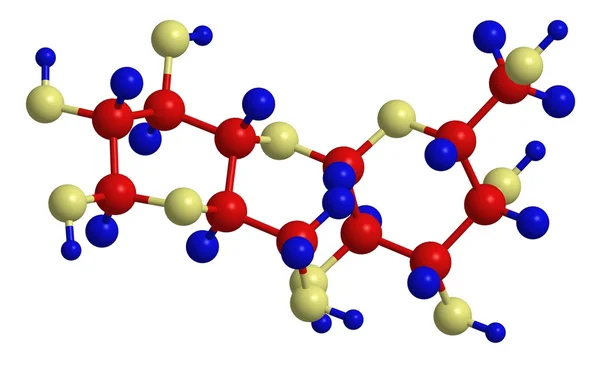
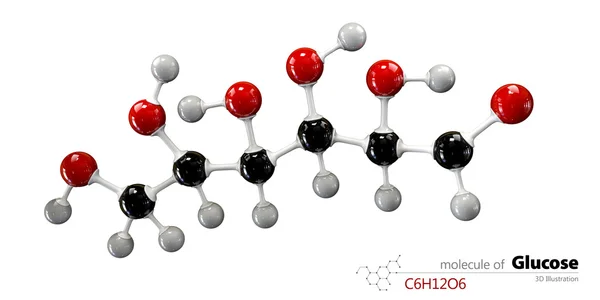
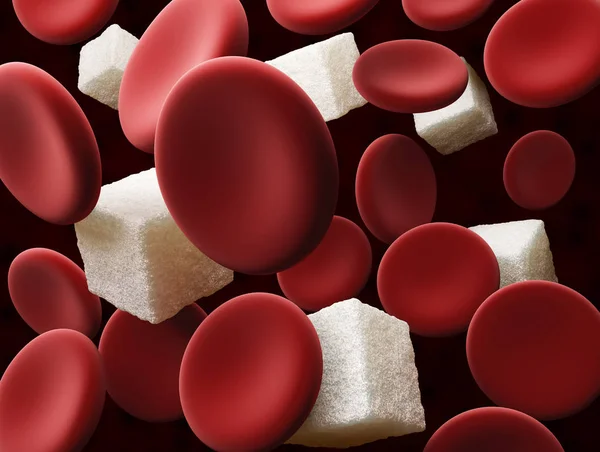
Stock image Sugar Biochemistry

stock vector Aerobic respiration. Cellular respiration. Pyruvate enter the mitochondria in order to be oxidized by the Krebs cycle. products of this process are carbon dioxide, water, and energy. Vector diagram for educational, biological, science and medical use

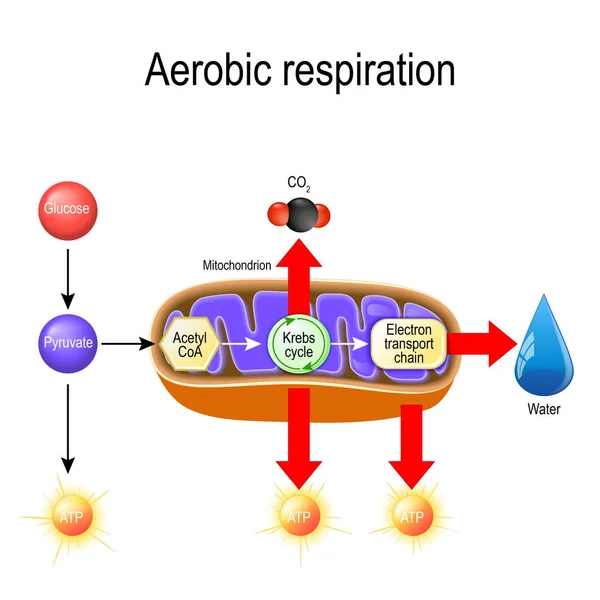
Aerobic Respiration. Cellular Respiration. Pyruvate Enter The Mitochondria In Order To Be Oxidized By The Krebs Cycle. Products Of This Process Are Carbon Dioxide, Water, And Energy. Vector Diagram For Educational, Biological, Science And Medical Use

Vector, 0.85MB, 3946 × 3946 eps
stock image Pile of sugar and word Fructose with drawn scheme on paper against yellow background

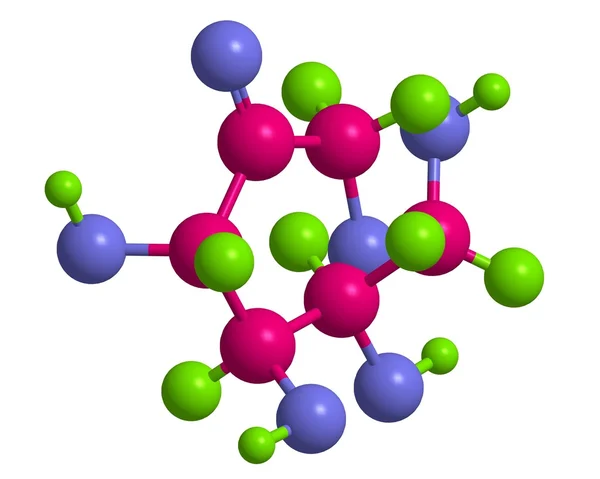
Pile Of Sugar And Word Fructose With Drawn Scheme On Paper Against Yellow Background

Image, 7.72MB, 6720 × 4480 jpg
stock image Molecular structure of Guanosine triphosphate

Molecular Structure Of Guanosine Triphosphate

Image, 0.21MB, 2239 × 1944 jpg
stock vector Deoxyribose, a a precursor to DNA

Deoxyribose, A A Precursor To DNA

Vector, 0.01MB, 5943 × 4200 eps
stock image Molecular structure of adenosine

Molecular Structure Of Adenosine

Image, 0.17MB, 2413 × 1677 jpg
stock vector Stevioside structural formula

Stevioside Structural Formula

Vector, 0.24MB, 6827 × 3660 eps
stock image Abstract black glittering DNA double helix with depth of field. Animation of DNA construction from debrises 3d rendering. Science animation. Genom futuristic footage. Conceptual design of genetics

Abstract Black Glittering DNA Double Helix With Depth Of Field. Animation Of DNA Construction From Debrises 3d Rendering. Science Animation. Genom Futuristic Footage. Conceptual Design Of Genetics

Image, 0.48MB, 3840 × 2160 jpg
stock image The technician performs a general blood test for the patient.

The Technician Performs A General Blood Test For The Patient.

Image, 12.45MB, 5149 × 3433 jpg
stock vector Glucose levels in the blood diagram - hyperglycemia, hypoglycemia, diabetes

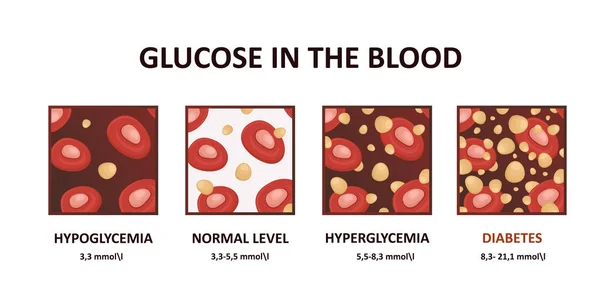
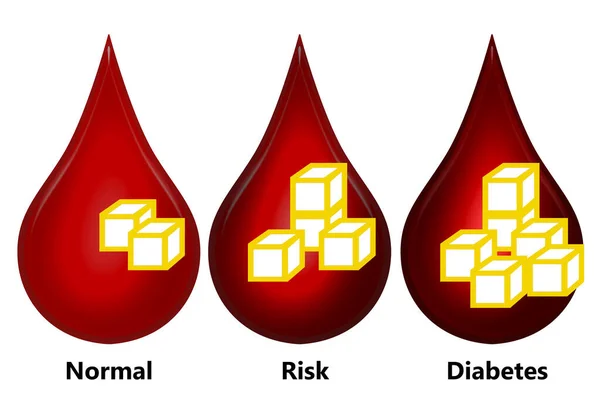
Glucose Levels In The Blood Diagram - Hyperglycemia, Hypoglycemia, Diabetes

Vector, 1.31MB, 8175 × 4100 eps
stock vector Saccharin, benzoic sulfimide, chemical formula and skeletal structure. Artificial sweetener with no food energy. Code 954. 304 to 400 times sweeter than table sugar. Illustration over white. Vector.

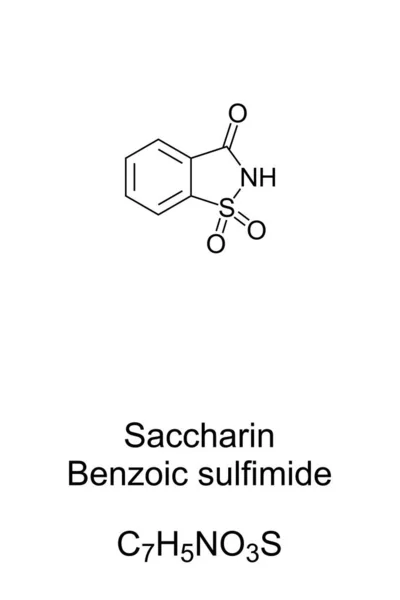
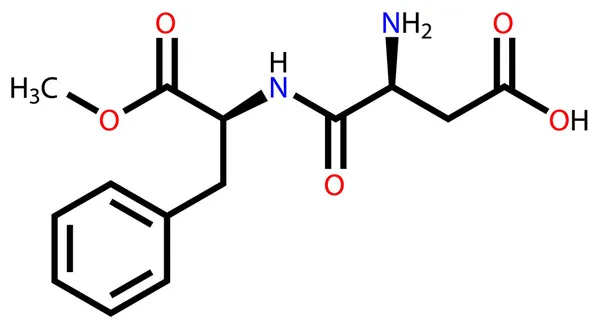
Saccharin, Benzoic Sulfimide, Chemical Formula And Skeletal Structure. Artificial Sweetener With No Food Energy. Code 954. 304 To 400 Times Sweeter Than Table Sugar. Illustration Over White. Vector.

Vector, 1.89MB, 6000 × 9000 eps
stock image Abstract blue glittering DNA double helix with depth of field. Animation of DNA construction from debrises. Science animation. 3d rendering Genom futuristic footage. Conceptual design of genetics

Abstract Blue Glittering DNA Double Helix With Depth Of Field. Animation Of DNA Construction From Debrises. Science Animation. 3d Rendering Genom Futuristic Footage. Conceptual Design Of Genetics

Image, 1.17MB, 3840 × 2160 jpg
stock image Abstract blue glittering DNA double helix with depth of field. Animation of DNA construction from debrises. Science animation. 3d rendering Genom futuristic footage. Conceptual design of genetics

Abstract Blue Glittering DNA Double Helix With Depth Of Field. Animation Of DNA Construction From Debrises. Science Animation. 3d Rendering Genom Futuristic Footage. Conceptual Design Of Genetics

Image, 1.02MB, 3840 × 2160 jpg
stock image Molecular structure of hyaluronic acid

Molecular Structure Of Hyaluronic Acid

Image, 0.16MB, 3064 × 1333 jpg
stock vector Functions of carbs and carbohydrates in digestive system outline diagram

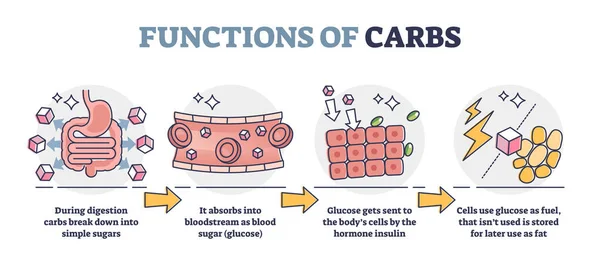
Functions Of Carbs And Carbohydrates In Digestive System Outline Diagram

Vector, 6.09MB, 6000 × 2700 eps
stock image Abstract blue glittering DNA double helix with depth of field. Animation of DNA construction from debrises. Science animation. 3d rendering Genom futuristic footage. Conceptual design of genetics

Abstract Blue Glittering DNA Double Helix With Depth Of Field. Animation Of DNA Construction From Debrises. Science Animation. 3d Rendering Genom Futuristic Footage. Conceptual Design Of Genetics

Image, 1.22MB, 3840 × 2160 jpg
stock vector Deoxyribonucleic acid molecule spiral with DNA nucleobases molecular formulas. DNA molecule with nucleobases structure - cytosine, guanine, adenine, thymine. Deoxyribonucleic acid structure

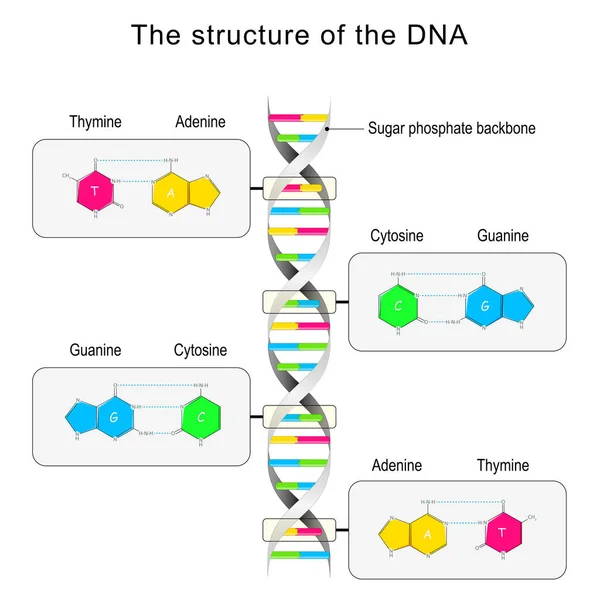
Deoxyribonucleic Acid Molecule Spiral With DNA Nucleobases Molecular Formulas. DNA Molecule With Nucleobases Structure - Cytosine, Guanine, Adenine, Thymine. Deoxyribonucleic Acid Structure

Vector, 0.37MB, 6500 × 6000 eps
stock image Pancreatic gland on white

Pancreatic Gland On White

Image, 5.42MB, 4096 × 4096 jpg
stock image Pancreatic gland cells

Pancreatic Gland Cells

Image, 5.42MB, 4096 × 4096 jpg
stock image Molecular structure of chondroitin sulfate

Molecular Structure Of Chondroitin Sulfate

Image, 0.6MB, 2546 × 1573 jpg
stock image Molecular structure of hormone cortisol

Molecular Structure Of Hormone Cortisol

Image, 0.5MB, 2546 × 1573 jpg
stock image Glucose molecule, ball and stick model. Glucopyranose.

Glucose Molecule, Ball And Stick Model. Glucopyranose.

Image, 1.82MB, 6000 × 3000 jpg
stock image Lactose molecular structure isolated on white

Lactose Molecular Structure Isolated On White

Image, 1.26MB, 8000 × 4110 jpg
stock image Blood sugar level isolated on white background, 3d rendering

Blood Sugar Level Isolated On White Background, 3d Rendering

Image, 2.92MB, 6000 × 4000 jpg
stock image Urinalysis for urolithiasis in container. Urine samples for analysis in laboratory. Kidney stone disease self health examination. Danger or warning red background, copy space.

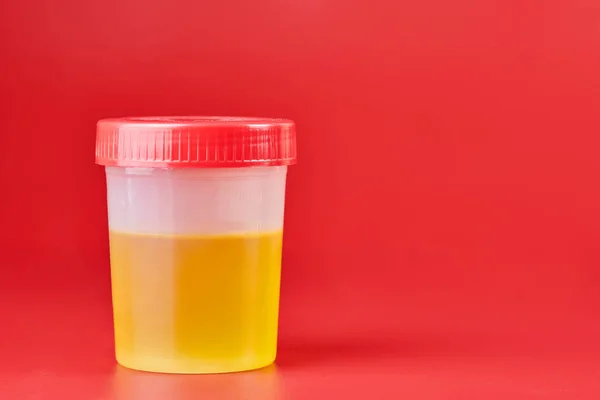
Urinalysis For Urolithiasis In Container. Urine Samples For Analysis In Laboratory. Kidney Stone Disease Self Health Examination. Danger Or Warning Red Background, Copy Space.

Image, 4.68MB, 8256 × 5504 jpg
stock image Molecular structure of adenosine diphosphate

Molecular Structure Of Adenosine Diphosphate

Image, 0.49MB, 2381 × 1838 jpg
stock vector Aspartame structural formula

Aspartame Structural Formula

Vector, 0.21MB, 6761 × 3696 eps
stock image Molecular structure of insulin

Molecular Structure Of Insulin

Image, 4.2MB, 4516 × 4231 jpg
stock image Molecular structure of sucrose, 3D rendering

Molecular Structure Of Sucrose, 3D Rendering

Image, 0.16MB, 2594 × 1601 jpg
stock image Molecular structure of inositol (vitamin B8), 3D rendering

Molecular Structure Of Inositol (vitamin B8), 3D Rendering

Image, 0.35MB, 2804 × 1480 jpg
stock image Molecular structure of neotame

Molecular Structure Of Neotame

Image, 0.56MB, 2546 × 1573 jpg
stock image Pancreatic gland on white

Pancreatic Gland On White

Image, 6.42MB, 4096 × 4096 jpg
stock image Pancreatic gland cells

Pancreatic Gland Cells

Image, 6.42MB, 4096 × 4096 jpg
stock image Molecular structure of aspartame

Molecular Structure Of Aspartame

Image, 0.42MB, 2546 × 1573 jpg
stock image Molecular structure of lactose (in form of Beta lactose)

Molecular Structure Of Lactose (in Form Of Beta Lactose)

Image, 0.6MB, 2546 × 1573 jpg
stock image Molecular structure of Cytidine triphosphate

Molecular Structure Of Cytidine Triphosphate

Image, 0.26MB, 2710 × 1577 jpg
stock vector Spiral of DNA and RNA. differences in the structure of the DNA and RNA molecules. icons and Infographic Educational Vector Illustration.

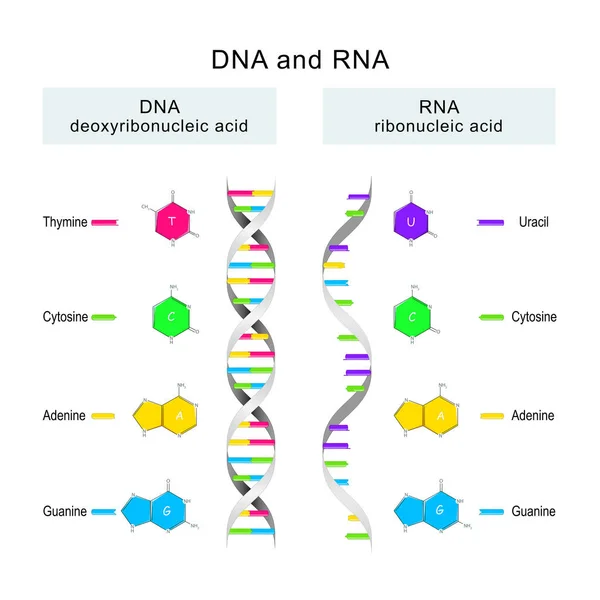
Spiral Of DNA And RNA. Differences In The Structure Of The DNA And RNA Molecules. Icons And Infographic Educational Vector Illustration.

Vector, 1MB, 4444 × 4444 eps
stock image Secretion of insulin on a person with diabetes type 2. Diabetes type 2 (or non-insulin-dependent) is a form of diabetes mellitus affecting mainly adults over 40 due to a food too rich in fat, the metabolism of glucose is very perturbated. The muscle

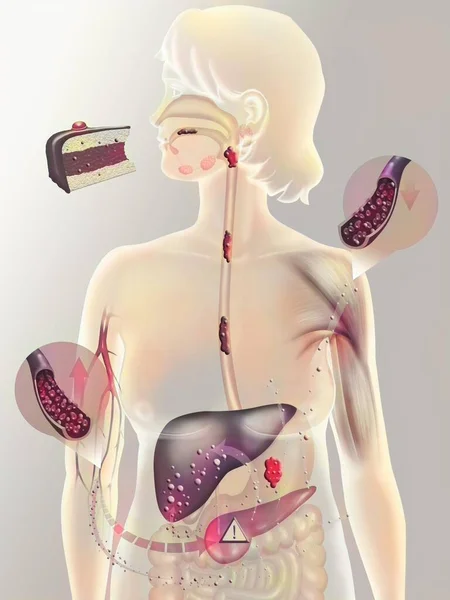
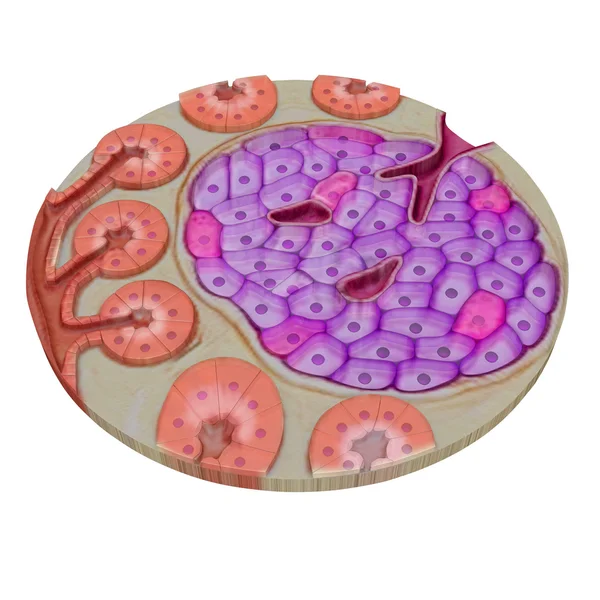
Secretion Of Insulin On A Person With Diabetes Type 2. Diabetes Type 2 (or Non-insulin-dependent) Is A Form Of Diabetes Mellitus Affecting Mainly Adults Over 40 Due To A Food Too Rich In Fat, The Metabolism Of Glucose Is Very Perturbated. The Muscle

Image, 0.59MB, 3630 × 4838 jpg
stock image Glucagon molecule, 3D illustration. Glucagon is a peptide hormone, produced by alpha cells of the pancreas raising concentration of glucose in the bloodstream

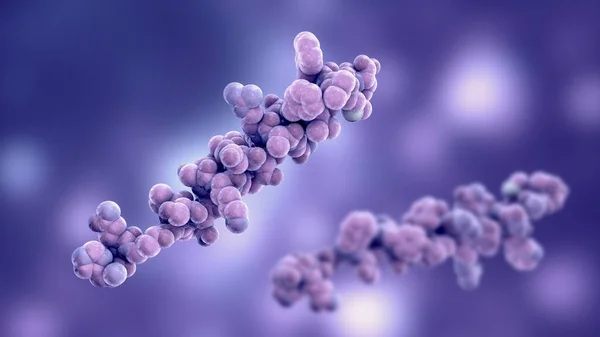
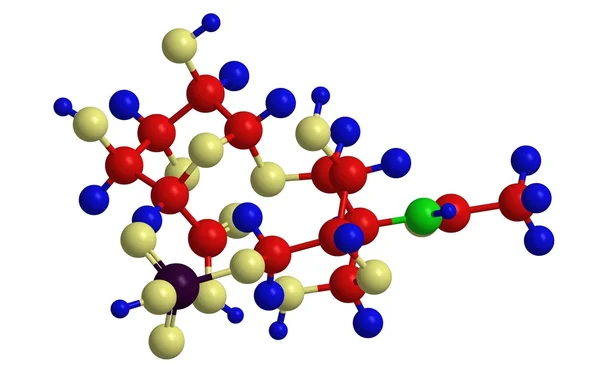
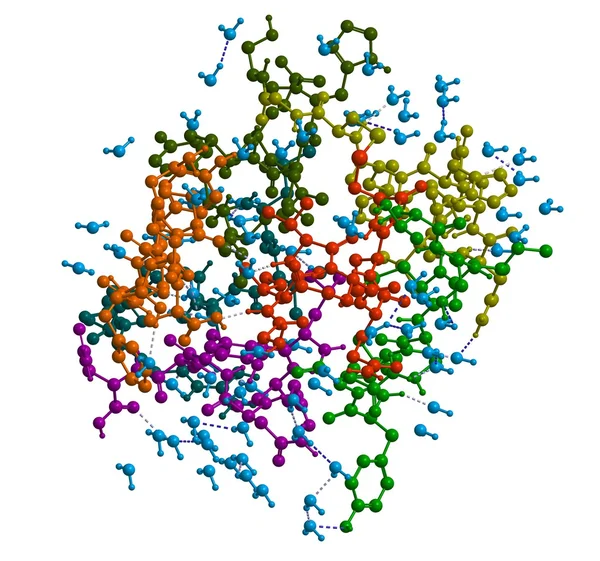
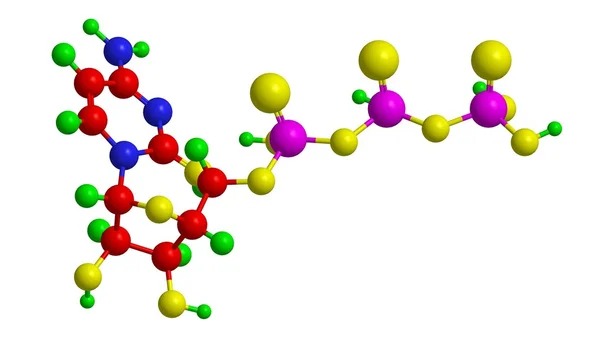
Glucagon Molecule, 3D Illustration. Glucagon Is A Peptide Hormone, Produced By Alpha Cells Of The Pancreas Raising Concentration Of Glucose In The Bloodstream

Image, 5.27MB, 7200 × 4050 jpg
stock vector The level of sugar in the blood. Hypoglycemia. Hyperglycemia. Infographics. Vector illustration

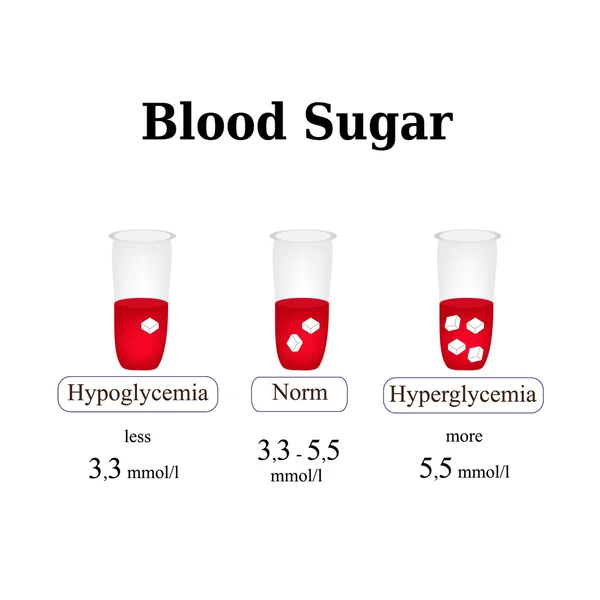
The Level Of Sugar In The Blood. Hypoglycemia. Hyperglycemia. Infographics. Vector Illustration

Vector, 2.59MB, 5000 × 5000 eps
stock image Molecular structure of fructose (fruit sugar)

Molecular Structure Of Fructose (fruit Sugar)

Image, 0.49MB, 2383 × 1734 jpg
stock image Molecule of glucose isolated on white - 3d render

Molecule Of Glucose Isolated On White - 3d Render

Image, 3.66MB, 6000 × 4500 jpg
stock image Glucose molecule, ball and stick model. Glucopyranose.

Glucose Molecule, Ball And Stick Model. Glucopyranose.

Image, 1.86MB, 6000 × 3000 jpg
stock vector Steviol structural formula. The constituent of sweet stevia plan

Steviol Structural Formula. The Constituent Of Sweet Stevia Plan

Vector, 0.23MB, 5458 × 4932 eps
stock image Sugar in the blood. blood cell with cube of sugar, 3d Illustration

Sugar In The Blood. Blood Cell With Cube Of Sugar, 3d Illustration

Image, 10.2MB, 5432 × 4094 jpg
stock image Molecular structure of fructose (fruit sugar)

Molecular Structure Of Fructose (fruit Sugar)

Image, 0.53MB, 2295 × 1832 jpg
stock image human glucose transformation

Human Glucose Transformation

Image, 5.32MB, 3840 × 2160 jpg
stock image human glucose transformation

Human Glucose Transformation

Image, 5.14MB, 3840 × 2160 jpg
stock image human glucose transformation

Human Glucose Transformation

Image, 6.35MB, 3840 × 2160 jpg
stock image Fructose molecular structure on black background

Fructose Molecular Structure On Black Background

Image, 0.7MB, 4917 × 3664 jpg
stock vector DNA structure. Base pairing and nucleotide. Cytosine, Thymine, Guanine, Adenine. Vector illustration

DNA Structure. Base Pairing And Nucleotide. Cytosine, Thymine, Guanine, Adenine. Vector Illustration

Vector, 1.02MB, 4444 × 4444 eps
Page 1 >> Next